Figure 4.
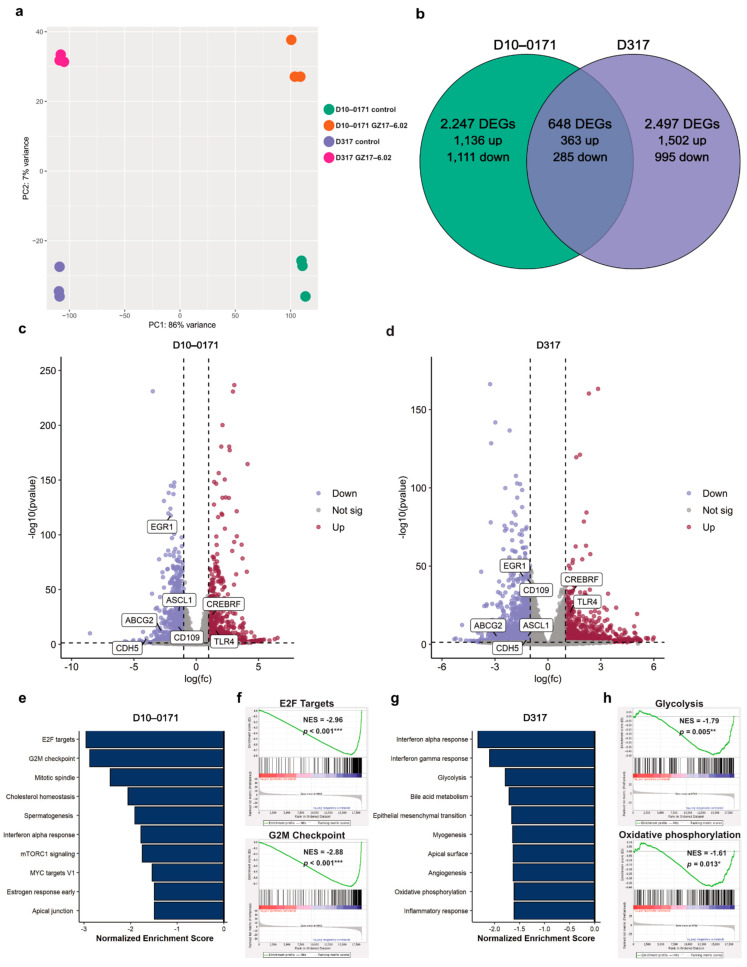
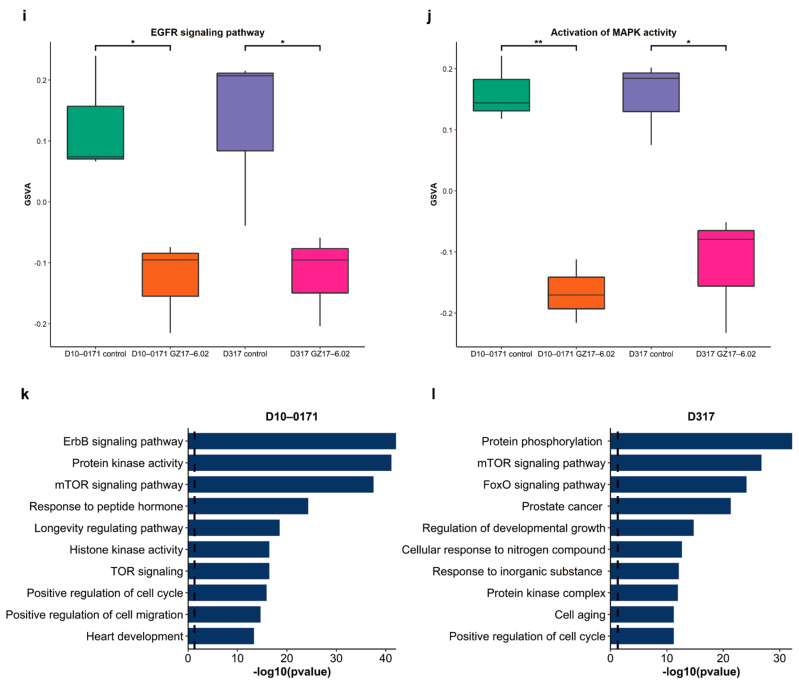
GZ17-6.02 induces changes in gene and protein expression in GSCs. (a) PCA plot of transcriptome data demonstrates separation of control and GZ17-6.02 treated D10-0171 and D317 GSCs. (b) Venn diagram of shared and unique differentially expressed genes in GZ17-6.02 treated D10-0171 and D317 GSCs. (c) Volcano plot of differentially expressed genes in D10-0171 following GZ17-6.02 treatment. (d) Volcano plot of differentially expressed genes in D317 following GZ17-6.02 treatment. Shared differentially expressed genes in GZ17-6.02 treated D10-0171 and D317 GSCs that are associated with glioblastoma growth and invasion are labeled on both volcano plots. (e) Top 10 downregulated pathways in D10-0171 following GZ17-6.02 treatment identified by GSEA using the Hallmark database as reference. (f) Enrichment plots for E2F targets and G2M checkpoint in GZ17-6.02 treated D10-0171 GSCs. (g) Top 10 downregulated pathways in D317 following GZ17-6.02 treatment identified by GSEA using the Hallmark database as reference. (h) Enrichment plots for glycolysis and oxidative phosphorylation in GZ17-6.02 treated D317 GSCs. (i) GSVA comparison of EGFR signaling pathway in control and GZ17-6.02 treated D10-0171 and D317 GSCs. (j) GSVA comparison of activation of MAPK activity pathway in control and GZ17-6.02 treated D10-0171 and D317 GSCs. (k) Functional enrichment analysis (Metascape [36]) of downregulated pathways across input gene lists of phospho-proteins in D10-171 showing decreased expression following GZ17-6.02 treatment. (l) Functional enrichment analysis (Metascape [36]) of downregulated pathways across input gene lists of phospho-proteins in D317 showing decreased expression following GZ17-6.02 treatment. Dashed lines represent a p-value of 0.05 * p < 0.05, ** p < 0.01, *** p < 0.001. DEG, differentially expressed gene; NES, normalized enrichment score; mTOR, mammalian target of rapamycin; EGFR, epidermal growth factor receptor; GSVA, gene set variation analysis; TOR, target of rapamycin.


