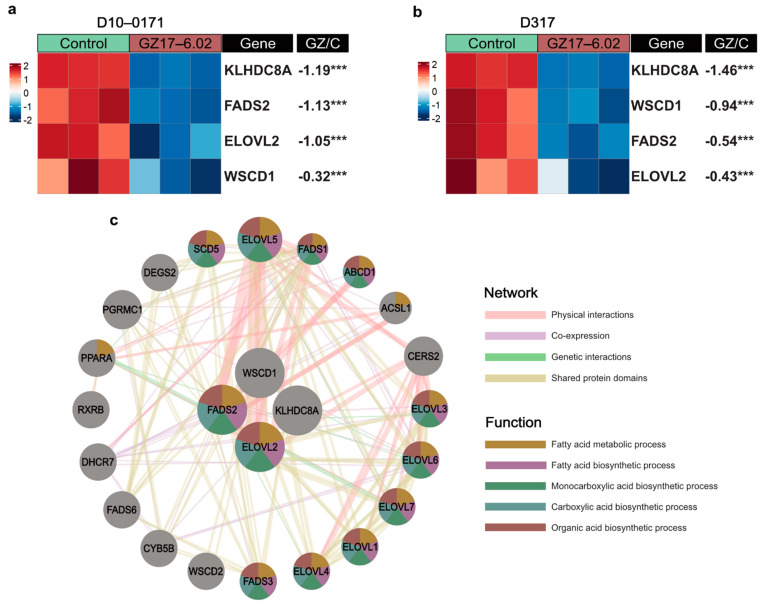
Figure 5.
GZ17-6.02 downregulates key GSC super-enhancer genes. (a) Heatmap of mRNA expression of GSC super-enhancer genes in control and GZ17-6.02 treated D10-0171 GSCs. (b) Heatmap of mRNA expression of GSC super-enhancer genes in control and GZ17-6.02 treated D317 GSCs. The p-values shown are false discovery rate-adjusted p-values. (c) GeneMANIA functional association gene network for GSC super-enhancer genes. Physical interactions and genetic interactions are shown as pink and green lines, respectively, while co-expression is shown as purple lines, and shared protein domains are shown as yellow lines. Stronger associations are shown with thicker lines. Genes are colored based on the top 5 over-represented shared function. Genes colored yellow share functions related to the fatty acid metabolic process, genes colored purple share functions related to the fatty acid biosynthetic process, genes colored green share functions related to the monocarboxylic acid biosynthetic process, genes colored blue share functions related to the carboxylic acid biosynthetic process, and genes colored red share functions related to the organic acid biosynthetic process. Fold change shown is log base 2-fold change. *** p < 0.001. GZ, GZ17-6.02; C, control.

