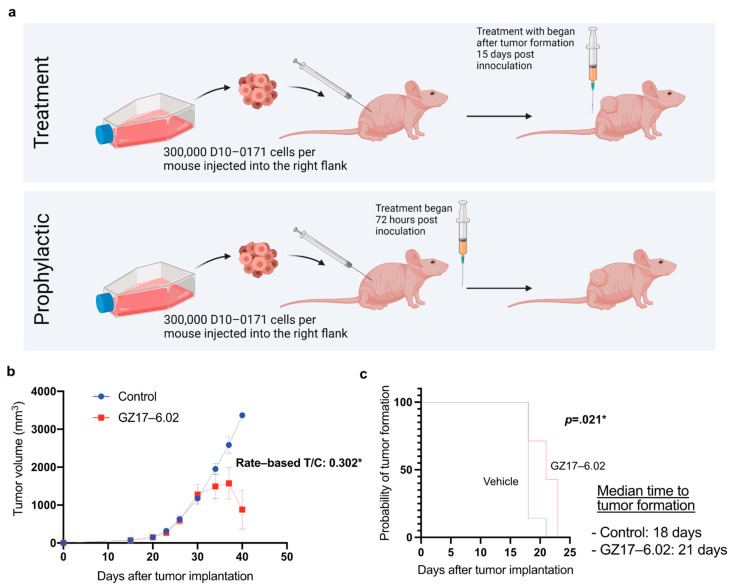
Figure 7.
GZ17-6.02 demonstrated anti-tumor activity in a subcutaneous tumor model. (a) Flow chart depicting the study protocol with athymic NU/NU mice. This figure was created with biorender.com (accessed on August 20, 2021) (b) Average tumor volume per mouse plotted over time in control and treated mice, and analysis of tumor volume data using the rate-based T/C method. A rate-based T/C value below 0.4 indicates that the compound had a significant effect on tumor growth. (c) Kaplan–Meier analysis of tumor onset demonstrating that GZ17-6.02 delays tumor formation. * denotes a significant value. n, number of animals; T/C, tumor/control.

