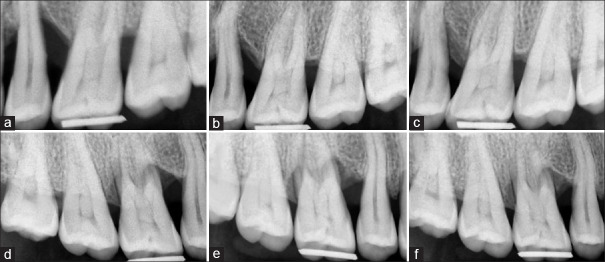
Figure 4.
Radiographic images of follow-up at baseline, 3 months, and 6 months intervals. (a) An intrabony defect from the test group at baseline. (b) An improvement in the intrabony defect from the test group at 3 months. (c) An improvement in the intrabony defect from the test group at 6 months. (d) An intrabony defect from the control group at baseline. (e) An improvement in the intrabony defect from the control group at 3 months. (f) An improvement in the intrabony defect from the control group at 6 months

