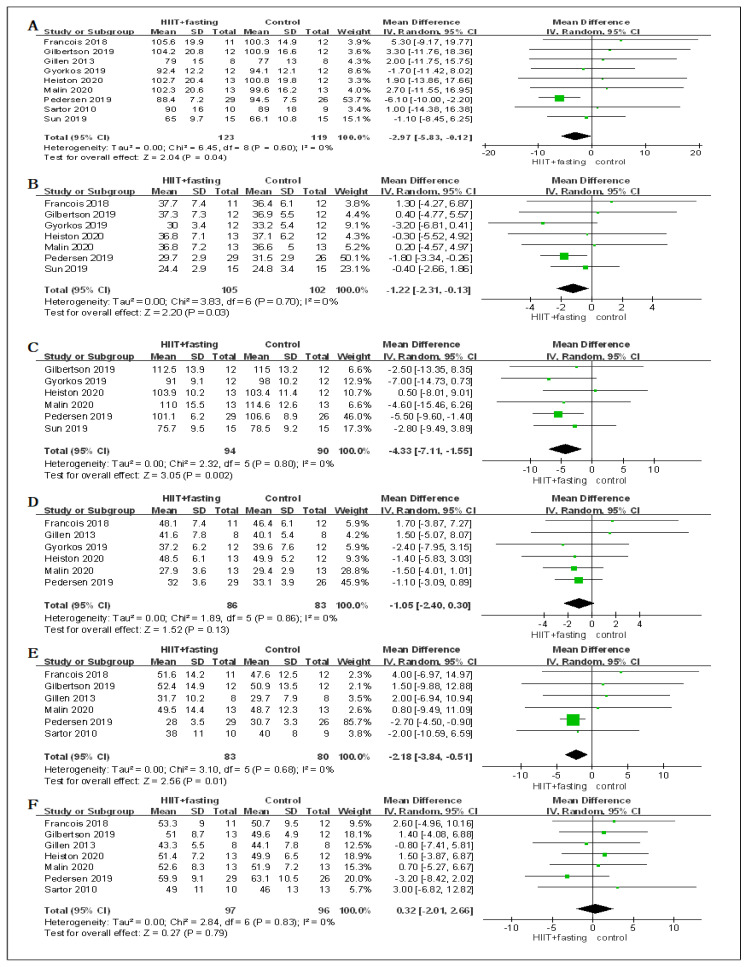
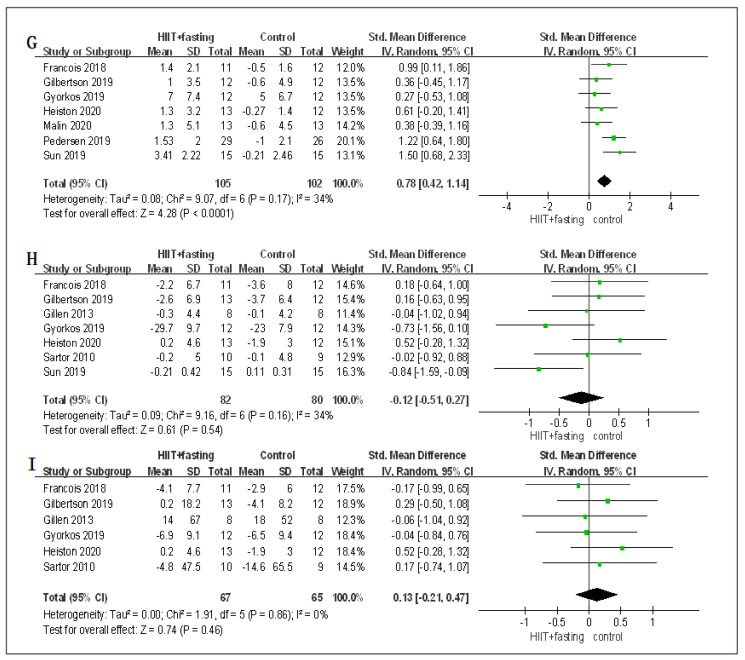
Figure 4.
Forest plot for the body composition. (A) Forest plot for the body mass (BM); (B) Forest plot for the body mass index (BMI); (C) Forest plot for the waist circumference (WC); (D) Forest plot for the percent fat mass (PFM); (E) Forest plot for the fat mass (FM); (F) Forest plot for the fat-free mass (FFM); (G) Forest plot for changes in VO2peak.; (H) Forest plot for changes in fasting plasma glucose (FPG); (I) Forest plot for changes in fasting plasma insulin (FPI). The size of each small green box represents the relative weight of the studies conducted in the meta-analysis. The black diamond represents the results of the meta-analysis combining the individual studies.


