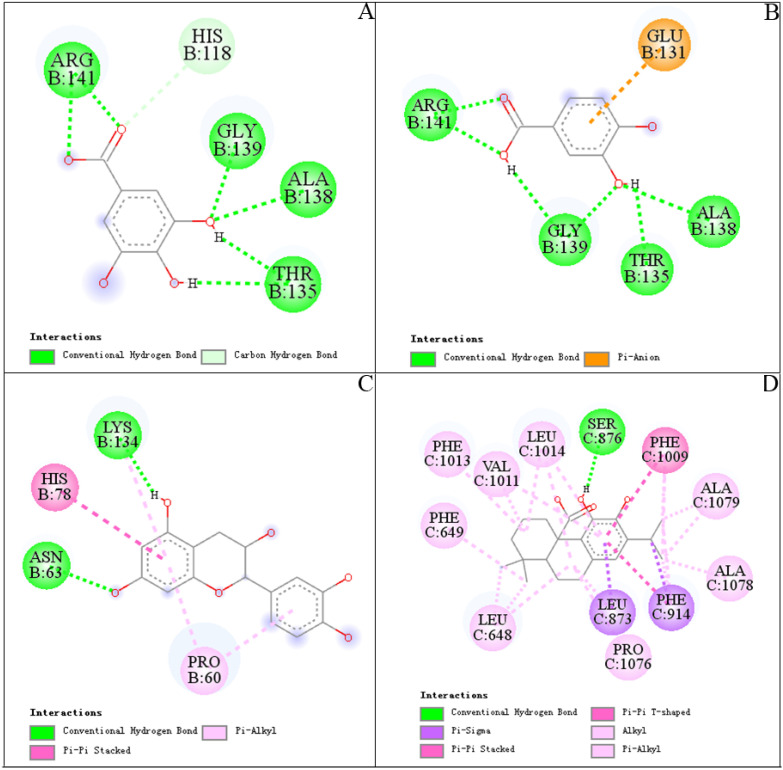
Figure 5.
Docked complexes of SOD and XOD with peak 1 (gallic acid), peak 3 (protocatechuic acid), peak 9 ((−)-epicatechin) and peak 15 (carnosic acid) from A. indica: (A), SOD-gallic acid; (B), SOD-protocatechuic acid; (C), SOD-(−)-epicatechin; (D), XOD-carnosic acid. Blue lines represent hydrogen bonds.

