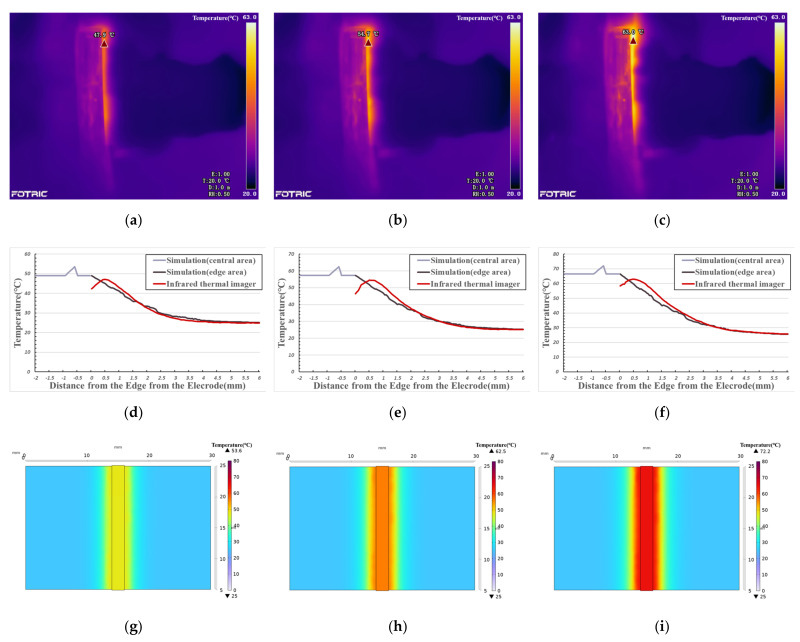
Figure 6.
(a): Thermal image (20 s); (b): Thermal image (25 s); (c): Thermal image (30 s); (d–f): Temperature comparison curve between infrared thermal imager data and simulation data; (d): 20 s; (e) 25 s; (f): 30 s; (g–i): Simulation image of temperature distribution with the same visual angle as thermal image. (g): corresponds to (a), 20 s; (h): corresponds to (b), 25 s; (i): corresponds to (c), 30 s.

