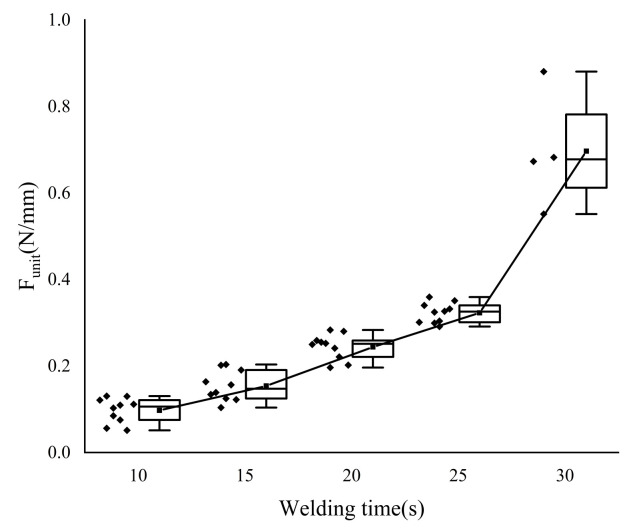
Figure 7.
T-peel test results. In order to calculate the average change rate when the welding time is 15 s in Table 3, we added additional welding strength data (welding time is 10 s) in the figure. Scattering points on the left side of the box are specific sample data points. Each group has 10 sample data. However, when the welding time is 30 s, some vessel samples are “burned out”, so there are only four samples.

