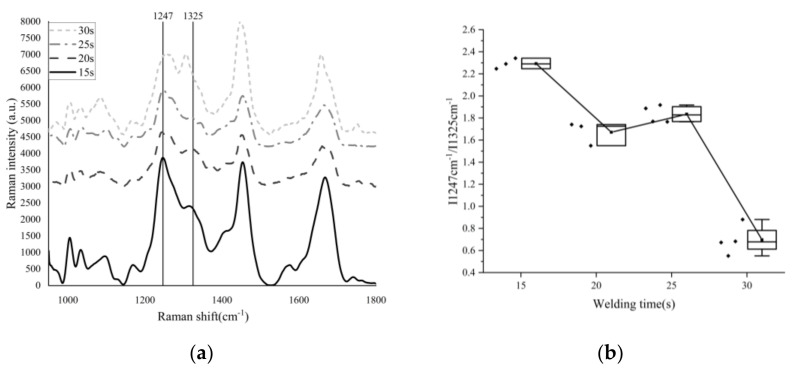
Figure 8.
(a): Raman spectrum data of vessel tissue with different welding times; (b): Density rate of I1247 cm−1 and I1325 cm−1. Scattering points on the left side of the box are specific sample data points. Y-axis coordinates only represent the Raman intensity of “15 s”. We vertically shift the Raman spectrum image of “20 s”,”25 s”and”30 s” in the Y-axis direction to different degrees, in order to compare the differences between them conveniently.

