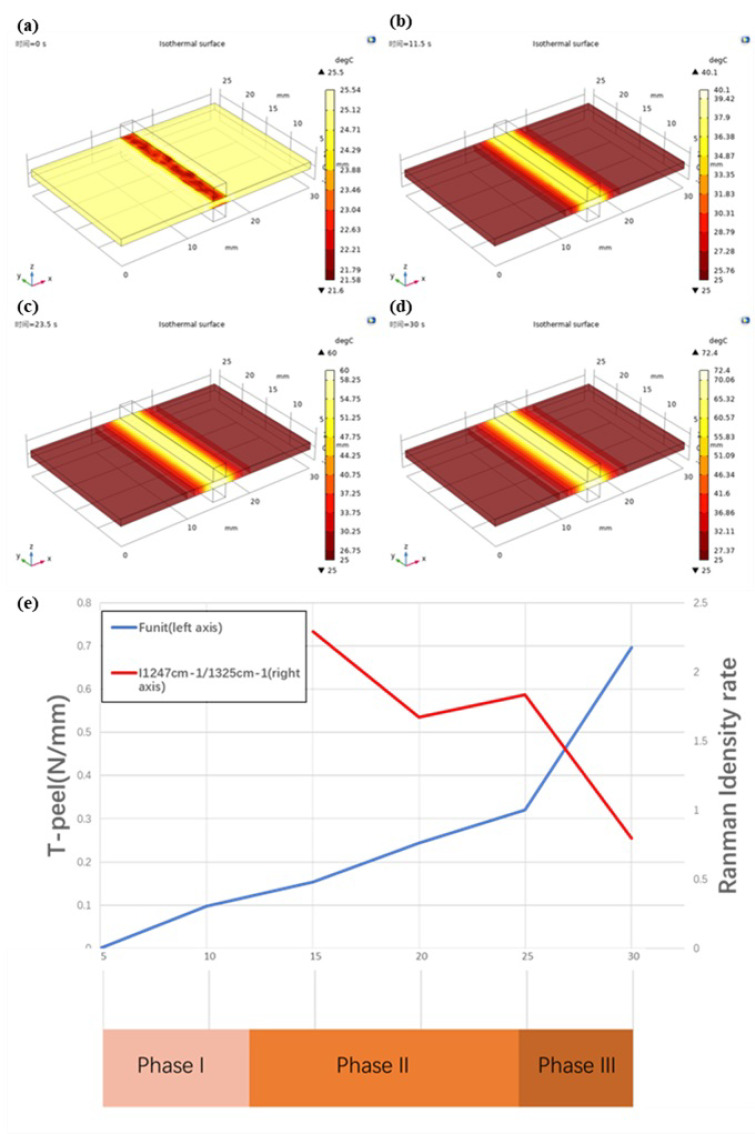
Figure 9.
T-peel data and Raman Spectrum data at different phases. (a): At the beginning of the welding experiment(t = 0 s), the initial temperature of vessel tissue is about 25 °C The central area of the vessel is fixed by a low−temperature (about 20 °C) metal electrode, and the temperature is reduced. (b): When the welding time is 11.5 s, the temperature in the central area of vessel tissue reaches 40 °C and spreads to both sides. (c): When the welding time is 23.5 s, the temperature in the central area of vessel tissue reaches 60 °C and spreads to both sides. (d): When the welding time is 30 s, the highest temperature of vessel tissue reaches 72.4 °C. (e): The left axis coordinates of the line chart represent the T−peel test strength, the right axis represents the ratio of I1247 cm−1/I1325 cm−1 and the horizontal axis coordinates represent the welding time. Phase I: 0−11.5 s, Phase II: 11.5−23.5 s, Phase III: 23.5−30 s.

