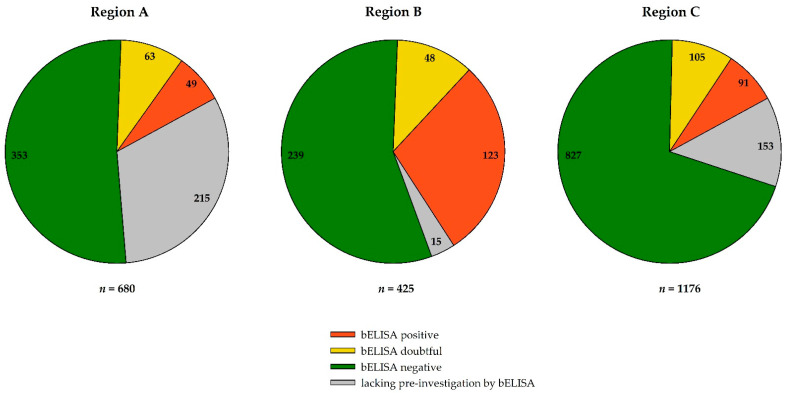
Figure 3.
Distribution of blocking ELISA (bELISA) results across the three different sample regions (A–C) of Germany in 2019–2020. In the pie charts, the negative bELISA results are depicted in green, the reactive but doubtful results in yellow, and positive results in orange. The grey segments represent samples for which an initial bELISA screening was not possible due to small sample volume.

