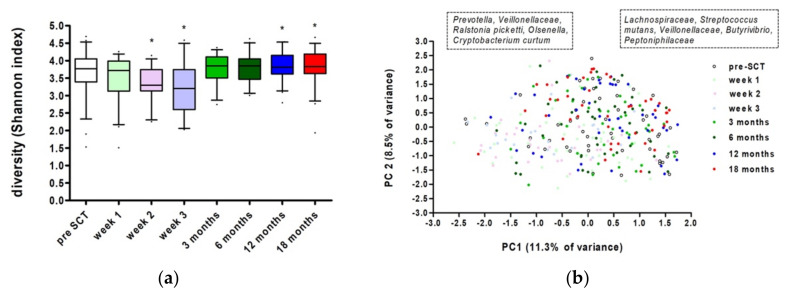
Figure 1.
Oral microbiome at all time points in the study: (a) Shannon diversity index (boxes show median and whiskers 5–95 percentile). * Marks significant differences compared to pre-SCT (Linear Mixed Model Analysis, p < 0.05); (b) principal component analysis plot. Left box indicates more abundant taxa at low values of the loadings of PC1, right box—at high values.

