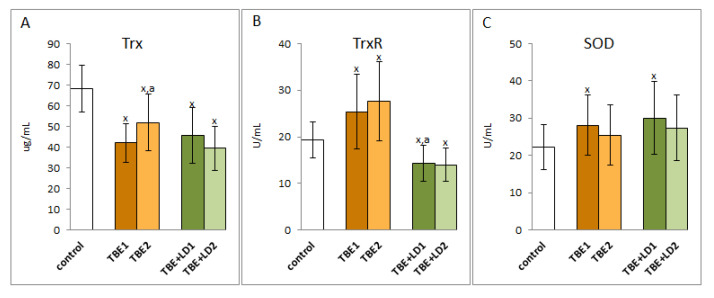
Figure 4.
The effect of TBEV infection (TBE1) and TBEV+Bb/Ap co-infection (TBE+LD1) as well as therapy (TBE2 and TBE+LD2) on the thioredoxin system including thioredoxin (Trx) (A) and thioredoxin reductase (TrxR) (B) as well as superoxide dismutase (SOD) (C) in plasma of patients compared to healthy subjects (control). The mean values for TBE patients (before–TBE1 and after treatment–TBE2, n = 40), patients with TBE+LD (before–TBE+LD1 and after treatment–TBE+LD2, n = 6) and control subjects (n = 20) with SD are shown as follows: x—differences vs. control group, p < 0.05; a—differences vs. TBE1 group, p < 0.05.

