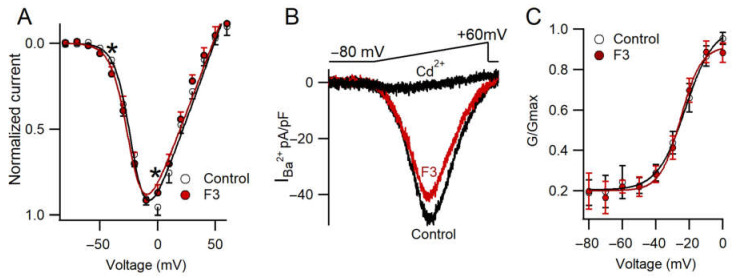
Figure 5.
F3 inhibits calcium current without changes in the voltage dependence. (A) I–V relationship for Control and F3 conditions. Each point represents the mean ± SEM. The solid line represents the best fit to a single Boltzmann equation (Equation (3)). Data were analyzed by two-way ANOVA (F(14,126) = 3.41, n = 9, * p ≤ 0.05). (B) Representative current elicited by a voltage-ramp protocol under Control, F3 and Cd2+ conditions. (C) Conductance curve in Control (white circles) and F3 condition (red circles). Each point represents the mean ± SEM. The solid line represents the best fit to a single Boltzmann equation (Equation (2)).

