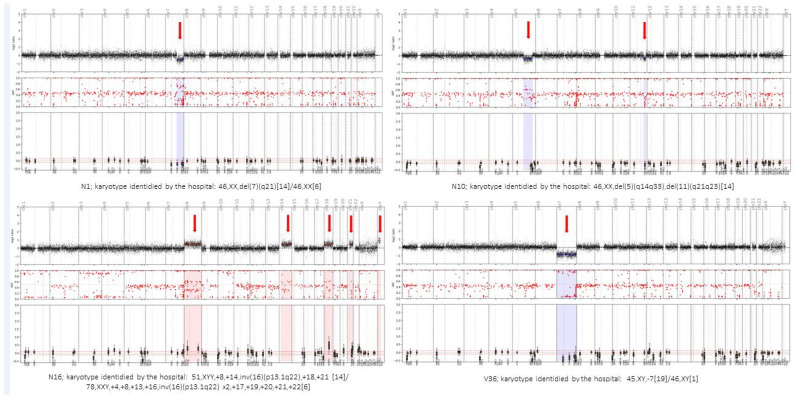
Figure 2.
Comparative examples between the conventional karyotype reported by the hospital and the CNV plot obtained using the Haematology OncoKitDX. The arrows indicate the gains and losses of chromosomal material evidenced by the bioinformatics pipeline, which is based on the off-target of the panel. The central image of small red dots is obtained from 996 SNPs distributed throughout the genome. The loss of heterozygosity that is detected in the regions affected by a CNV reinforces the gain or loss detected by means of the off-target-based pipeline. The lower image of each example represents the target genes of the panel in their chromosomal position.

