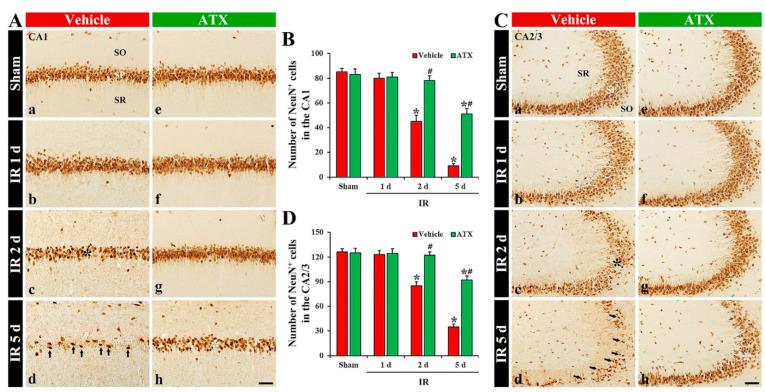
Figure 2.
(A,C) Representative photographs of NeuN immunohistochemistry in CA1 (A) and CA2/3 (C) of the vehicle-treated (left column) and ATX-treated (right column) groups in sham (Aa,Ca,Ae,Ce), and on day 1 (Ab,Cb,Af,Cf), day 2 (Ac,Cc,Ag,Cg), and day 5 (Ad,Cd,Ah,Ch) after IR. In the vehicle-IR group, a loss of NeuN-cells (black asterisks in (Ac,Cc)) in the SP of CA1-3 is observed on day 2 after IR. At five days after IR, NeuN-pyramidal cells of CA1-3 (arrows in (Ad,Cd)) are markedly decreased; however, in the ATX-IR group, many NeuN-pyramidal cells (white asterisks in (Ah,Ch)) are shown. Scale bar = 60 µm; (B,D) Mean numbers of NeuN-pyramidal cells in CA1 (B) and CA2/3 (D). The bars indicate the means ± SEM (n = 7, respectively; * p < 0.05 vs. corresponding sham group, # p < 0.05 vs. vehicle-IR group).

