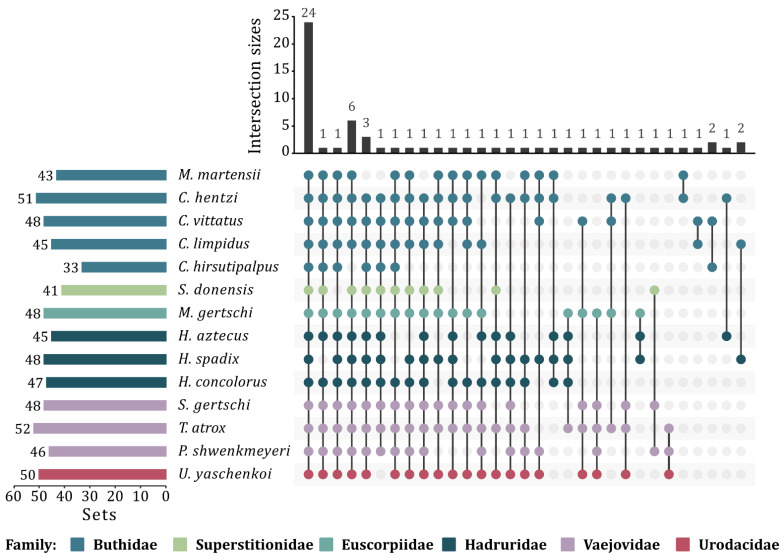
Figure 4.
Upset plot showing the graphical representation of the enzymatic core of the venoms of the studied scorpions. The upper bar graph shows the number of ECs contained in each intersection (intersection sizes). The number of sets (left side) indicates the degree of contribution of an EC or the level of interrelationship between species. The dot plot (right side) reflects the contribution of each species to the intersections.

