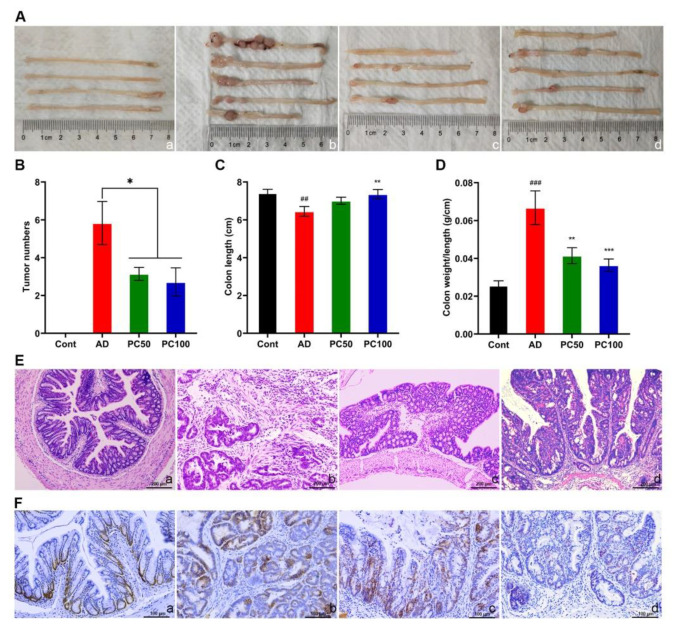
Figure 2.
PC suppressed the tumorgenesis induced by AOM/DSS. Gross morphology of colon (A), tumor number (B), colon length (C) and colon weight/length ratio (D) were studied. (E) Histological observation of mice colon. Scale bars 200 µm. (F) PC treatment decreased the number of PCNA-positive cells in the colon. Scale bars 100 μm. a, Cont group; b, AD group; c, PC50 group; d, PC100 group. Data were presented as means ± SEM (n = 6 for AD group and n ≥ 7 for the other groups). ## p < 0.01; ### p < 0.001 vs. Cont group; * p < 0.05; ** p < 0.01; *** p < 0.001 vs. AD group.

