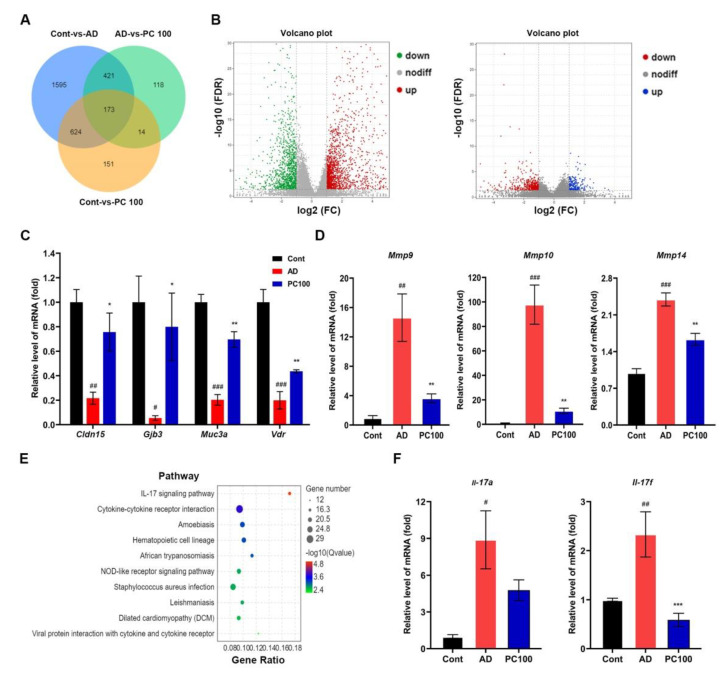
Figure 5.
RNA-Seq analysis of DEGs in colon of the Cont, AD and PC100 group mice: (A) Venn diagram of DEGs; (B) volcanogram of DEGs, left, Cont vs. AD, right, AD vs. PC100; (C) Up-regulated DEGs; (D) Down-regulated DEGs in PC100 group mice were selected and validated by qPCR analysis; (E) KEGG enrichment analysis of DEGs identified from AD vs. PC100; (F) qPCR evaluation of the expression of IL-17 pathway members Il-17a and Il-17f relative to that of Gapdh. Three replicates were carried out in the qPCR analysis (n = 3). # p < 0.01; ## p < 0.01; ### p < 0.001 vs. Cont group; * p < 0.05; ** p < 0.01; *** p < 0.001 vs. AD group.

