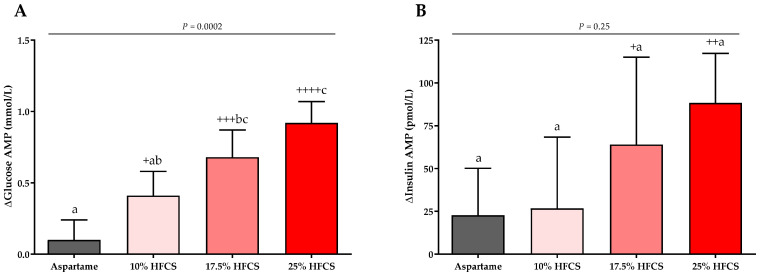
Figure 8.
Changes in glucose and insulin amplitudes (AMP): Mean ± SEM of the absolute changes (intervention − baseline) in glucose (A) and insulin AMPs (B) in participants consuming 0 (n = 23), 10 (n = 18), 17.5 (n = 15), or 25% (n = 28) HFCS-sweetened beverages for the two-week intervention. p = effect of HFCS group, two-factor (HFCS group, sex) ANCOVA with adjustment for MSRF and outcome at baseline; + p < 0.05, ++ p < 0.01, +++ p < 0.001, ++++ p < 0.0001, LS mean different from zero; a different from b, Tukey’s.

