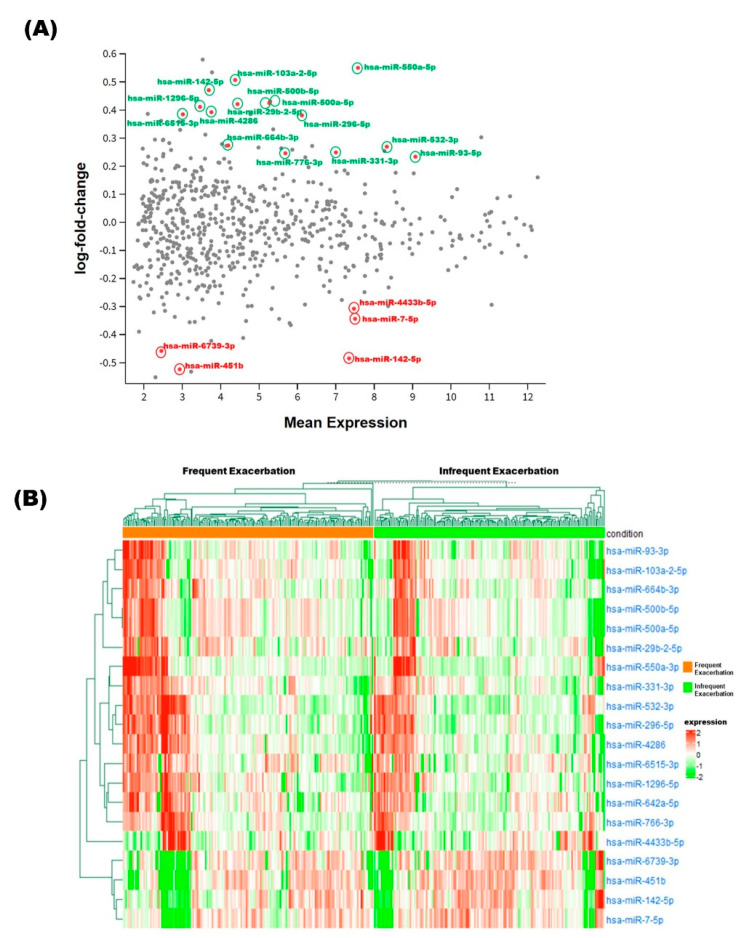
Figure 1.
(A) Differential expression of miRNA between frequent and no or infrequent exacerbations in the GACRS. Green and red color circles indicate up and downregulated miRs, respectively. Mean expression shown in log2 scale. (B) Clustered heat map of all 20 differentially expressed miRs across conditions in the GACRS. DESeq-2 normalized expression counts (shifted logarithm transformation) were used. Unsupervised hierarchical clustering was used to generate the heat map and Pearson correlation was used as the distance metric.

