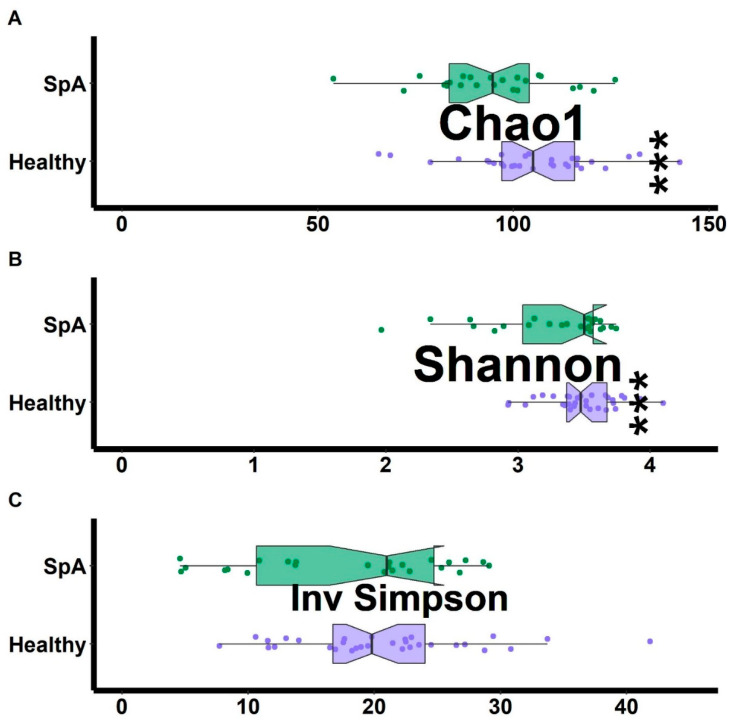
Figure 4.
Alpha diversity measures comparing HLA-B27+ offspring of AS patients to HLA-B27+ treatment-naïve children with SpA. The Chao1 measure of richness (A) along with the Shannon (B) and inverse Simpson measures of evenness (C) are shown. Asterisks indicate statistically significant difference (p < 0.05).

