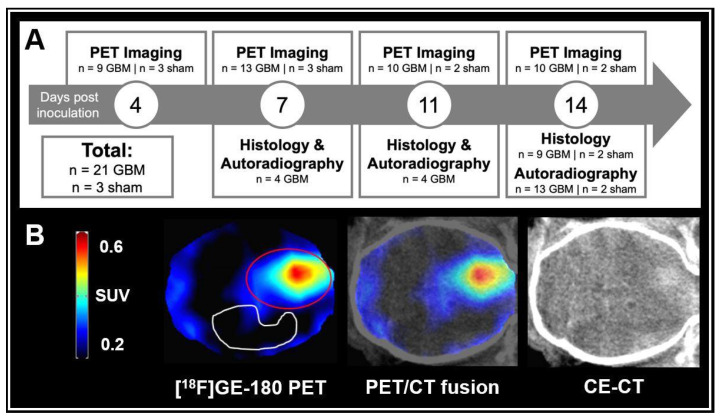
Figure 1.
(A) Study overview. n = 10 GBM mice and n = 2 sham mice completed longitudinal imaging until day 14 post inoculation. (B) GBM mouse at day 14 after tumor cell inoculation. [18F]GE-180 PET (left), a digital PET/CT fusion (middle) and CE-CT (right) are shown in axial plane. The [18F]GE-180 PET images were masked according to whole brain in CE-CT. Volume-of-interests (VOIs) used for uptake quantification are shown: Red line = 36 mm3 VOI at the site of inoculation. White line = 53 mm3 VOI in the tumor-free contralateral hemisphere serving as background.

