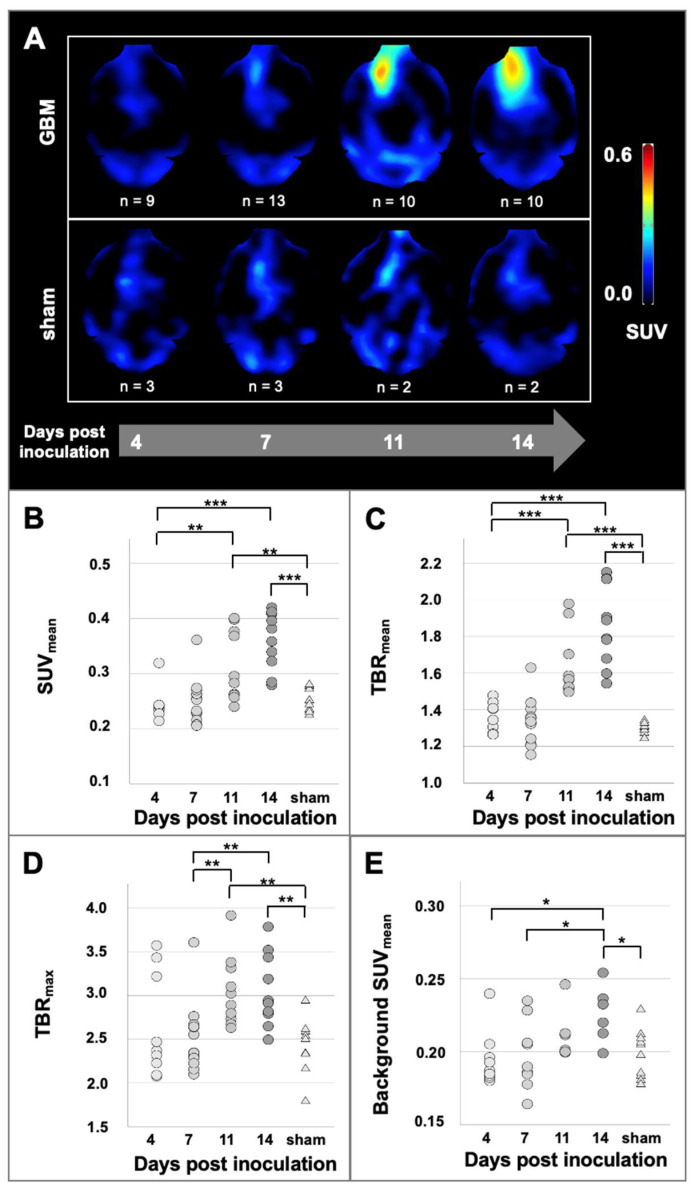
Figure 2.
(A) Longitudinal [18F]GE-180 PET images of GBM mice and sham mice. The [18F]GE-180 PET images were masked according to whole brain in CE-CT. Quantification of [18F]GE-180 uptake in PET at the inoculation site (B–D) and at the background in the contralateral hemisphere (E). The GBM mice are grouped according to their scan date (n = 9 at day 4, n = 13 at day 7, n = 10 at day 11 and n = 10 at day 14 post inoculation). The sham mice are pooled (n = 10). Significant differences between groups are marked by *** p < 0.001; ** p < 0.01; * p < 0.05 (ANOVA followed by Tukey post hoc test).

