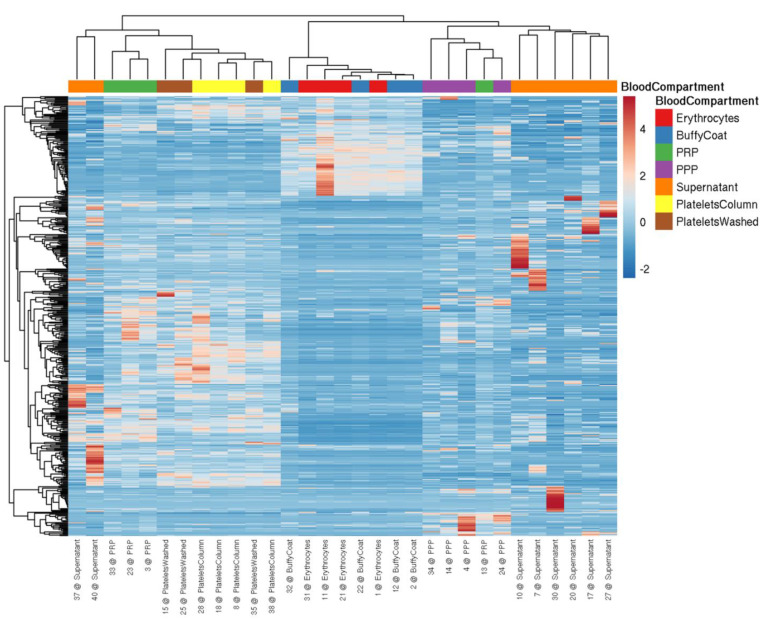
Figure 1.
Heatmap visualizing miRNA levels determined by NGS in blood cells and plasma from four healthy volunteers. miRNA profiles are suitable to distinguish between different blood cells (i.e., erythrocytes, leukocytes (buffy coat), and platelets (isolation via columns or washing steps)), plasma (i.e., PRP and PPP), and the supernatant of convulxin-stimulated platelets. The data were scaled using the unit variance method, and clustering was performed by applying the average method of the pheatmap package, calculating the distances as correlations.

