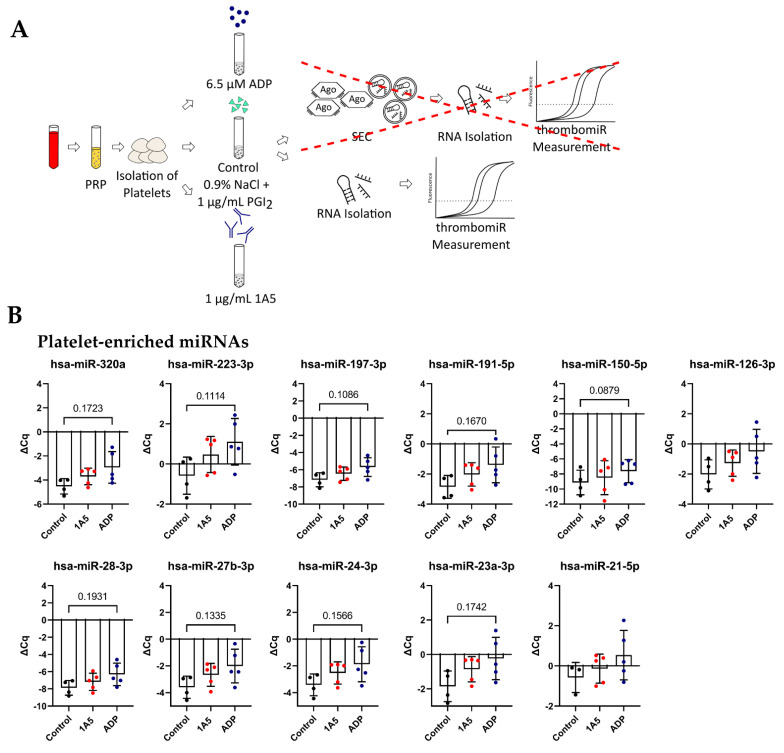
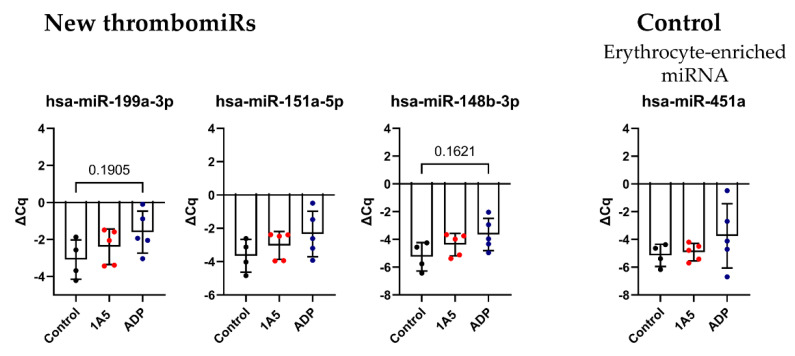
Figure 7.
Activation of isolated platelets in buffer results in miRNA release. (A) Experimental setup to investigate the release of miRNAs upon platelet activation in buffer. Two different agonists were used: 6.5 μM ADP and 1 μg/mL 1A5. Addition of 1 μg/mL PGI2 served as negative control. Supernatants were used directly for RNA isolation. (B) miRNA levels in the supernatant of activated platelets. qPCR data were RNA spike-in normalized (n = 5). The mean ± SD are plotted. We performed a mixed-effects analysis with Tukey’s multiple comparisons test. p-Values < 0.05 were considered significant. p-Values between 0.05 and 0.2 are depicted.


