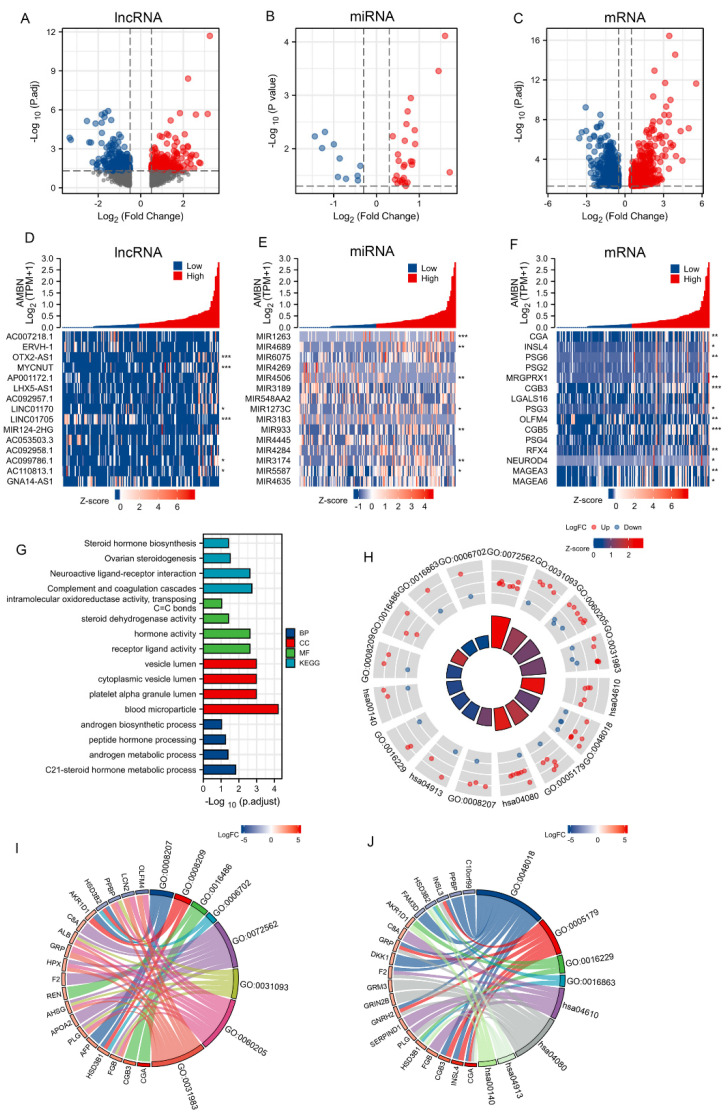
Figure 2.
Differential expression gene analysis between AMBN high and AMBN low expression in TGCT samples Volcano plot (A–C) and heat map (D–F) for DElncRNAs (adj p < 0.05 and |FC| > 0.5), DEmiRNAs (p < 0.05 and |logFC| > 0.3) and DEmRNAs (adj p < 0.05 and |logFC| > 0.5). and |logFC| > 0.3) and DEmRNAs (adj p < 0.05 and |logFC| > 0.5) (z-score indicates the expression level of the factor of interest in the corresponding sample, and * indicates the correlation between the factor of interest and AMBN). (G–J) GO and KEGG analysis of Differential expression gene (BP for Biological Process, MF for Molecular Function, and CC for Cellular Component, the logFC-score indicates the expression level at the factor of interest, *, p < 0.05; **, p < 0.01; ***, p < 0.001).

