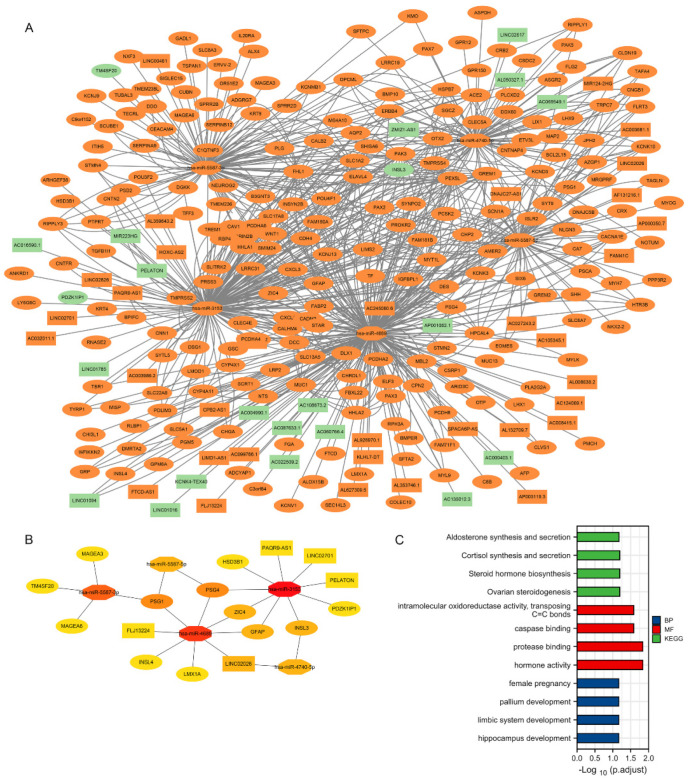
Figure 4.
Construction and functional enrichment analysis of the lncRNA-miRNA-mRNA triple regulatory network. (A) The triple regulatory network of TGCT. (Red indicates up-regulated mRNA expression, green means decreased mRNA expression; square for lncRNA, polygon as miRNA, circle to mRNA). (B) The 22 hub genes in the network (C) Functional enrichment analysis of DEmRNAs in the network (GO and KEGG).

