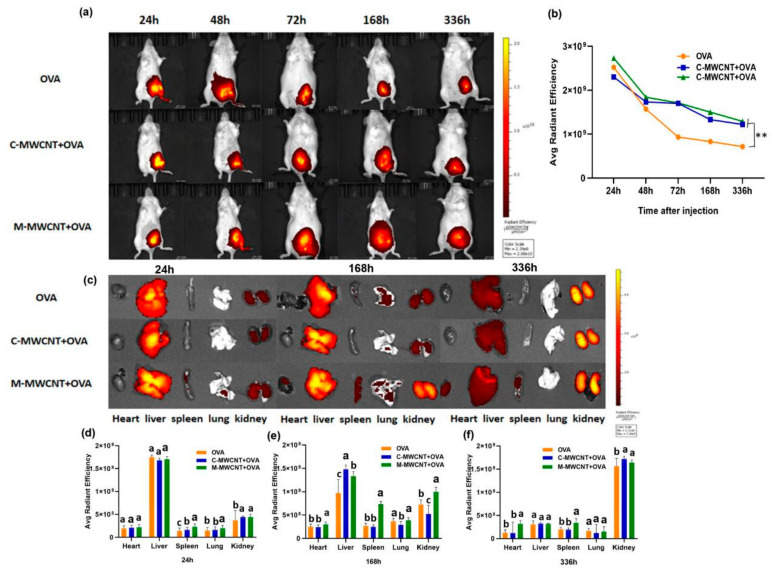
Figure 10.
Living animal imaging on ICR mice. The OVA was labeled using a Cy5.5 fluorescent dye, and the mice were immunized with M-MWCNT+OVA, C-MWCNT+OVA, or OVA. The living animal imaging and fluorescence intensities in the mice at 24, 48, 72, 168, and 336 h after injection was detected by an in vivo optical imaging system (a,b), ** p < 0.01. Direct imaging and fluorescence intensities of the spleen, liver, heart, kidney, and lung of injected mice were detected on 24, 168, and 336 h after injection (c–f). Different letters (a–c) above each group of bars indicate statistically significant differences (p < 0.05).

