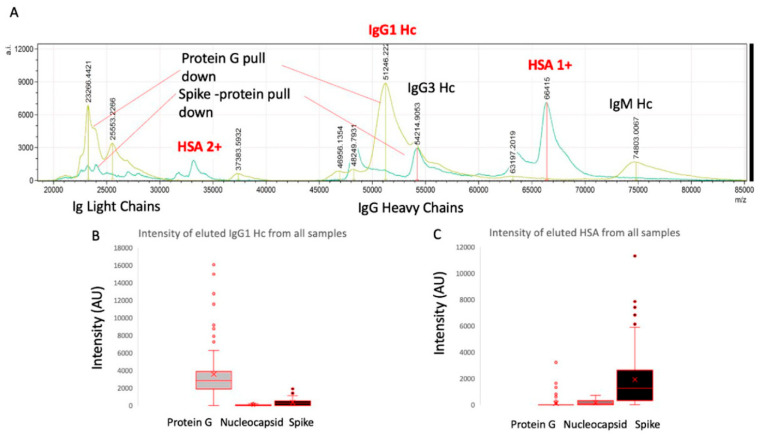
Figure 2.
Example mass spectra of eluted sample from protein G bead–captured proteins overlaid with spike protein–captured plasma proteins (panel A) and relative intensities of IgG1 heavy chains (IgG 1 Hc) recovered from the same samples by protein G, nucleocapsid and stabilised spike protein (panel B) versus HSA (single: 1+; doubly charged: 2+) recovered from the same samples by protein G, nucleocapsid and stabilised spike protein (panel C).

