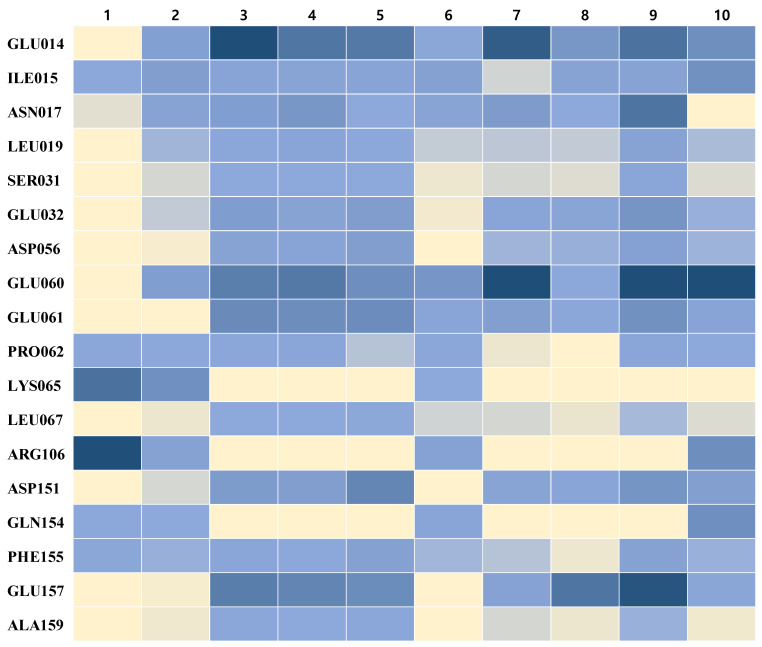
Figure 2.
Comparison of hotspot residues of MMP-9 involved in ligand binding. Hotspot residues are represented in the rows. Ligands are represented in the columns. In each box of the matrix, interactions between the ligand and the residues are colored from dark blue (PIE < −100 kcal/mol) and blue (PIE < −3 kcal/mol), to light-yellow (PIE > 0 kcal/mol). The PIE values are calculated at the FMO–RIMP2/PCM level.

