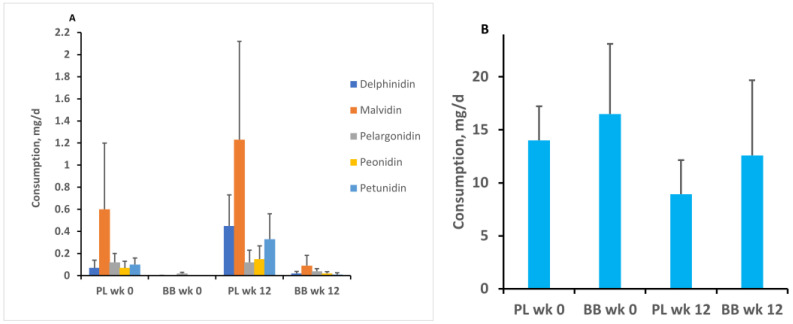
Figure 3.
Mean daily consumption external to the study for each of the major anthocyanins by group at enrollment and after 12 weeks. There was no between-group difference in consumption and no change relative to pre-intervention levels. Panel (A) shows consumption of delphinidin, malvidin, pelargonidin, peonidin, and petunidin, which were consumed at relatively lower levels. Panel (B) represents cyanidin levels, for which there was considerably greater intake. Note the difference in range of values on the vertical axes between panel (A) and panel (B). Error bars = SEM. PL = placebo group. BB = blueberry group. Wk 0 = pre-intervention assessment. Wk 12 = assessment during the final week of the intervention.

