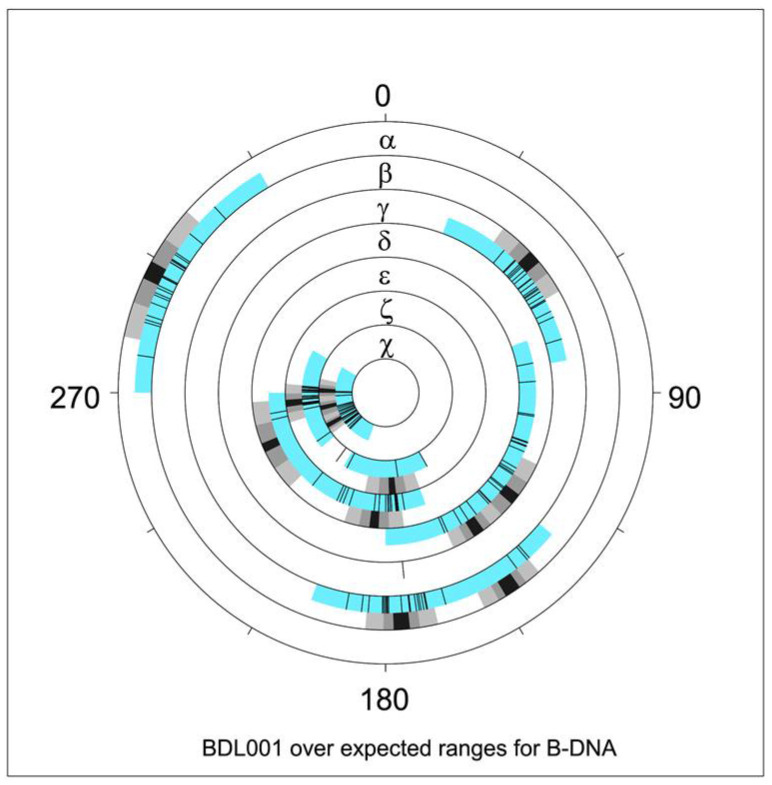
Figure 3.
NDB graphical report of torsion angle distribution [38] for the Drew–Dickerson dodecamer, PDB ID 1BNA, NDB ID BDL001 [11]. Blue sectors indicate torsion angle limits for all structures annotated as B–DNA. Overlaid black tick marks are measured torsion values for BDL001. Adjacent black/grey sectors denote average values and spreads of 1 and 2 estimated standard deviations. Note that two averages are indicated for several torsions, e.g., for δ (two distinct sugar puckers) and ε (BI versus BII forms). Values reflect NDB data available in 1996.

