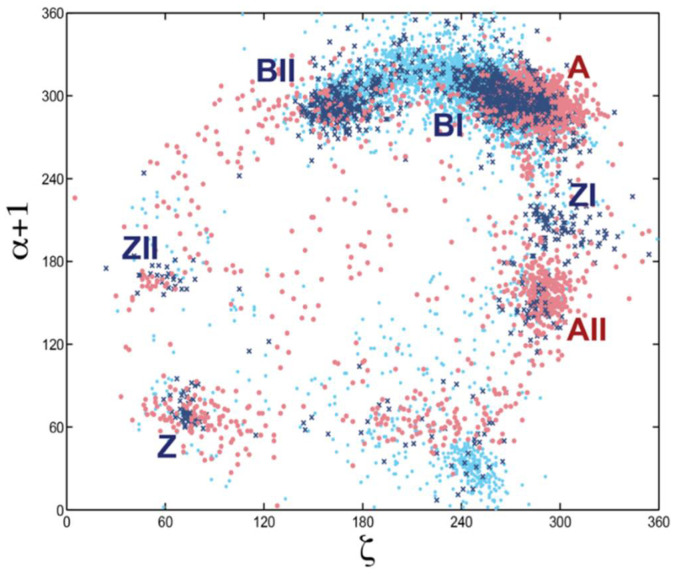
Figure 6.
Scatter plot of backbone torsion angles ζ and α + 1. ζ shows the variation in rotation around the O3′–P phosphodiester bond and α + 1 around the P–O5′ bond (labeled α + 1 because this bond belongs to the sequentially following nucleotide). Data for the DNA alone is shown as dark blue crosses, for protein-DNA complexes: light blue dots, and for RNA: red dots. The scattergram shows data for all nucleotide residues in the 1998 NDB. Clusters of some major conformational types are labeled. This analysis revealed that no nucleic acid form can be unequivocally classified by torsion angle pairs; a more sophisticated multidimensional analysis was needed.

