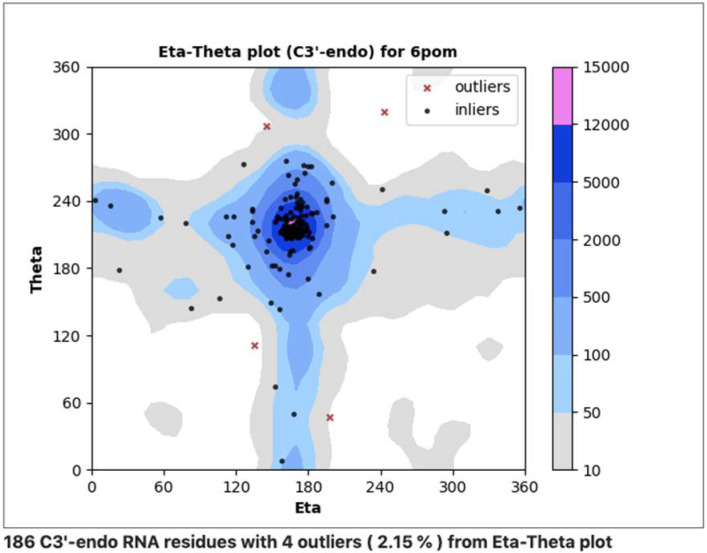
Figure 9.
Pseudotorsion plot, a simple coarse-level RNA backbone conformation validation tool. Measured eta and theta (η,θ) pseudotorsion values for each trinucleotide (black dots, red x’s) are plotted against a quality-filtered virtual torsion angle distribution derived from a large number of RNA structures (contours), analogous to the Ramachandran plot for proteins.

