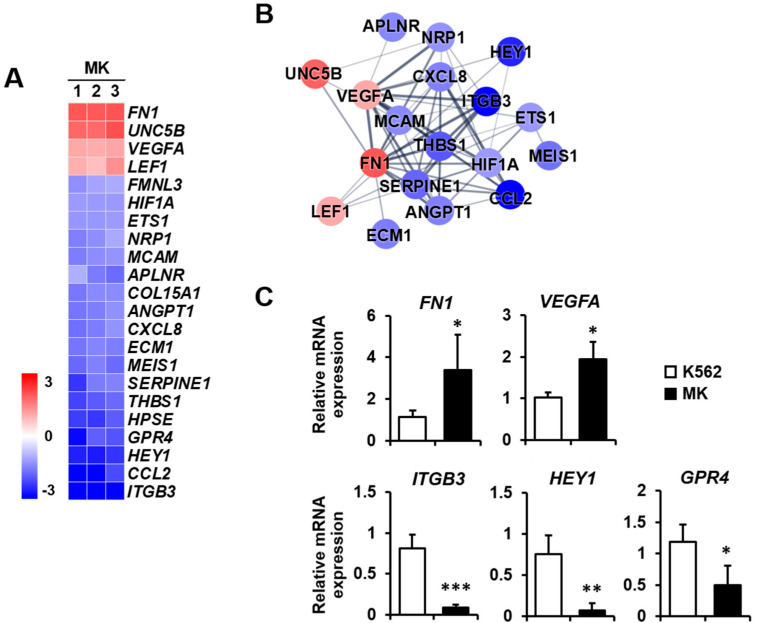
Figure 4.
Expression levels by z-scores of genes included in the angiogenesis cluster and the relationship between constituent genes. (A) Heat map of genes differentially expressed in MK compared with K562 cells based on the microarray analysis. The red color indicates upregulation and the blue color indicates downregulation. The degrees of colors represent the expression levels of the genes. (B) Protein–protein interaction analysis using the STRING database. The red and blue colors denote upregulation and downregulation, respectively. The higher the confidence in the interaction, the greater the line thickness between the proteins. Members without interaction with other genes were excluded from the STRING database analysis. (C) Validation of the mRNA expression of selected genes (FN1, VEGFA, ITGB3, HEY1, and GPR4) differentially expressed in MK by qPCR. Relative expression levels were plotted against gene expression levels in K562 cells. Data are presented as the mean ± standard deviation of three independent experiments. Please see abbreviations for the full names of genes. *, p < 0.05; **, p < 0.01; ***, p < 0.001 versus K562 cells.

