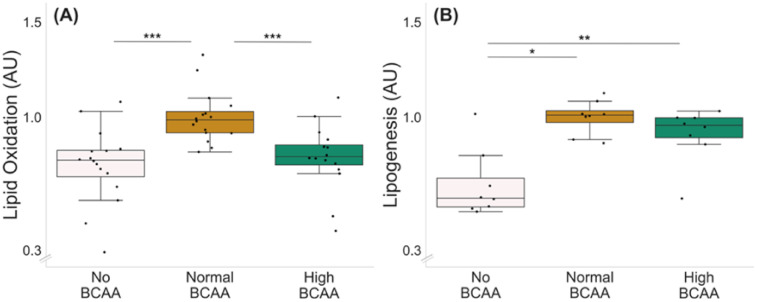
Figure 2.
Lipid oxidation (A) and lipogenesis (B) in C2C12 myotubes with different BCAA levels. (A) Normal BCAA level (0.8 mmol/L) led to higher lipid oxidation compared with no BCAA (0 mmol/L) or high BCAA (2.8 mmol/L). n = 16/group. (B) Normal and high BCAA levels led to higher lipogenesis compared with no BCAA. n = 8/group. Boxes in the boxplot figures depict interquartile ranges and medians, and whiskers represent the 95% confidence interval. * p ≤ 0.050, ** p ≤ 0.010, *** p ≤ 0.001. BCAA = branched-chain amino acid.

