
Fig 2.
Simulation results for  and
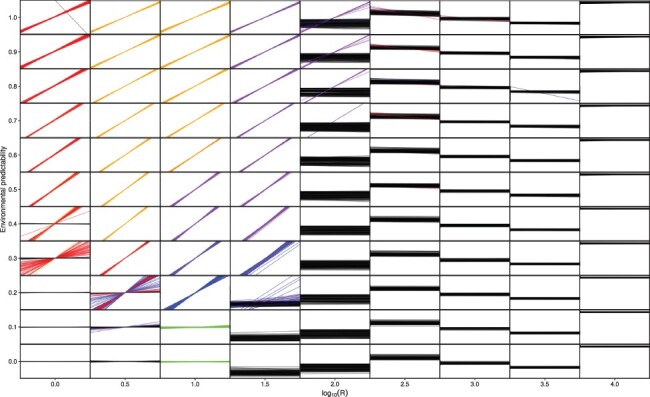
and  . For each small panel, the environmental cue is on the x-axis and phenotype on the y-axis. Each reaction norm is the population mean for one replicate simulation, and 100 replicates were performed for each combination of P and R. Red color shows reaction norms, where the population evolved reversible plasticity (
 or
or  , and
, and  ). Orange color shows reaction norms where reversible and anticipatory effects evolved (in addition
  ), blue color indicates that only developmental plasticity evolved (
 or
or  , and
, and  ), purple color indicates that both developmental plasticity and anticipatory effects evolved (in addition
  ), green color indicates that increased developmental variation evolved (
 ), and black color indicates that there was no major change in reaction norm slope (
 ). Note the logarithmic scale for R.