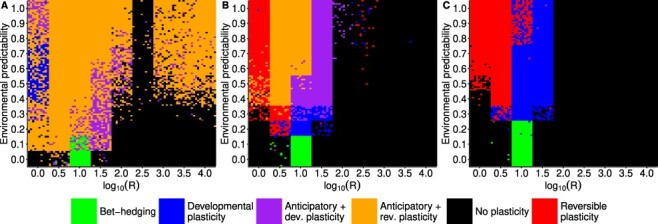
Fig 4.

Simulation results with different costs for phenotypic plasticity and anticipatory effects. For each parameter combination of P and R, 100 replicate simulations are represented as colored tiles, with colors corresponding to different strategies evolved in that replicate. Costs are (A)  , (B)
, (B)  and
and  , (C)
, (C)  and
and  .
.
