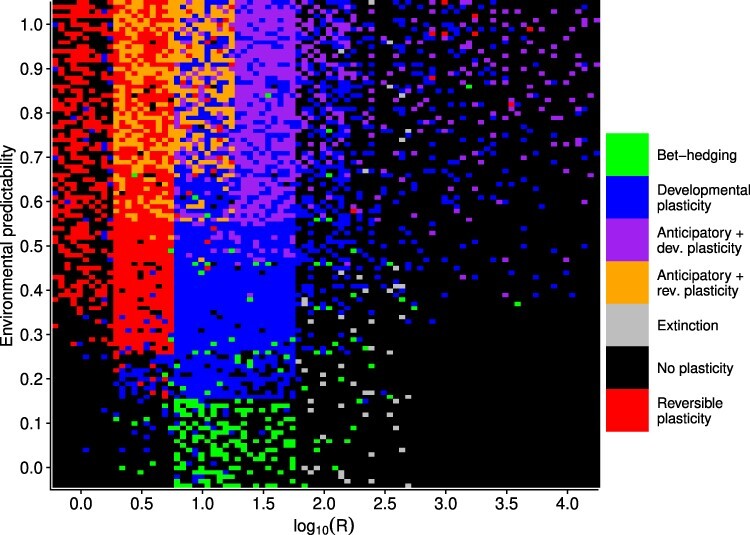
Fig 5.

Sensitivity of results to genetic architecture. Hundred replicate simulations were run for each combination of R and P, where parameter values for the random environmental effects, number of loci, number of chromosomes, mutation rate, and mutational effects were drawn randomly. Costs of plasticity were  and
and  . Colored tiles show which strategy evolved in the population or if it went extinct.
