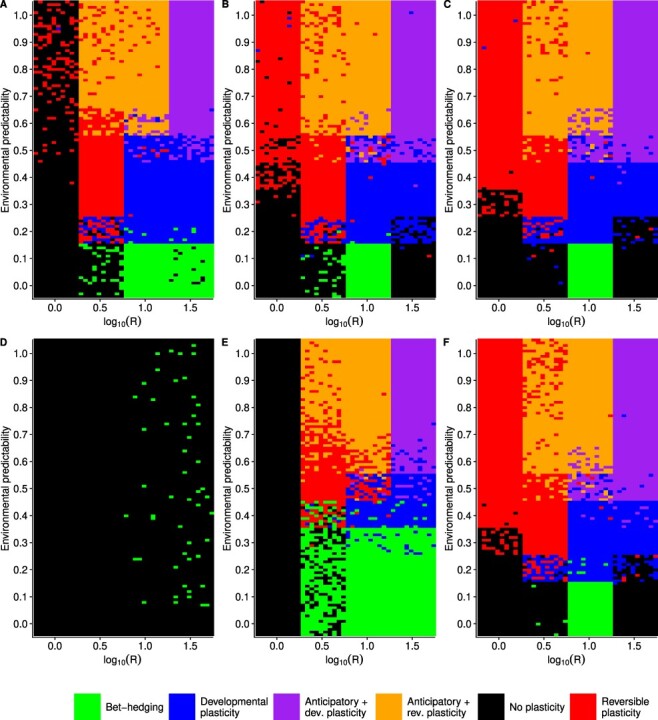
Fig 6.

Effects of number of loci (A–C) and standard deviation of mutational effects (D–F). Hundred replicate simulations were run for each combination of R and P, but only those values of R were used where I had previously observed the evolution of plasticity when plasticity had a cost. Cost of plasticity were  and
and  . Colored tiles show which strategy evolved in the population. (A)
  , (B)
, (B)  , (C)
, (C)  , (D)
, (D)  , (E)
, (E)  , (F)
, (F)  .
.
