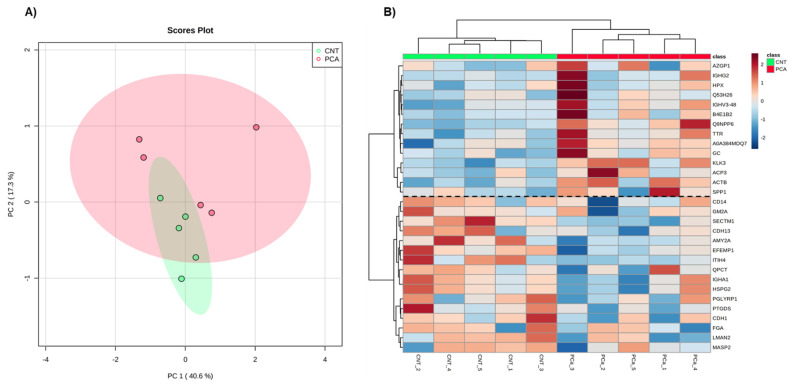
Figure 1.
Exploratory analysis of proteome data from MaxQuant. (A) Principal Component Analysis of the urine proteome of the two groups. (B) The heatmap of proteins identified in all individuals. Samples are represented in columns and proteins in rows. Proteins whose gene name is not available are indicated by their UniProt accession number. The dashed line on the heatmap indicates the two clusters of proteins.

