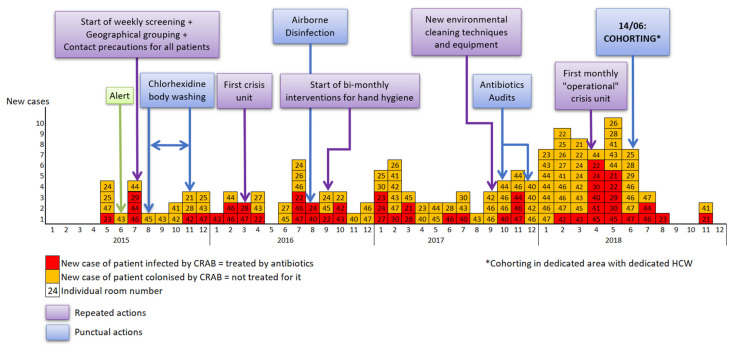
Figure 2.
Epidemic curve and major measures. The timeline of infection prevention measures interventions implemented in our Intensive Care Unit and the number of CRAB cases are represented according to the month and the year on the X-axis. New cases of patients colonized by CRAB are showed in orange, and patients infected by CRAB (clinical and microbiologically proven invasive infection) in red. Punctual actions are shown in light blue, and repeated actions in purple.

