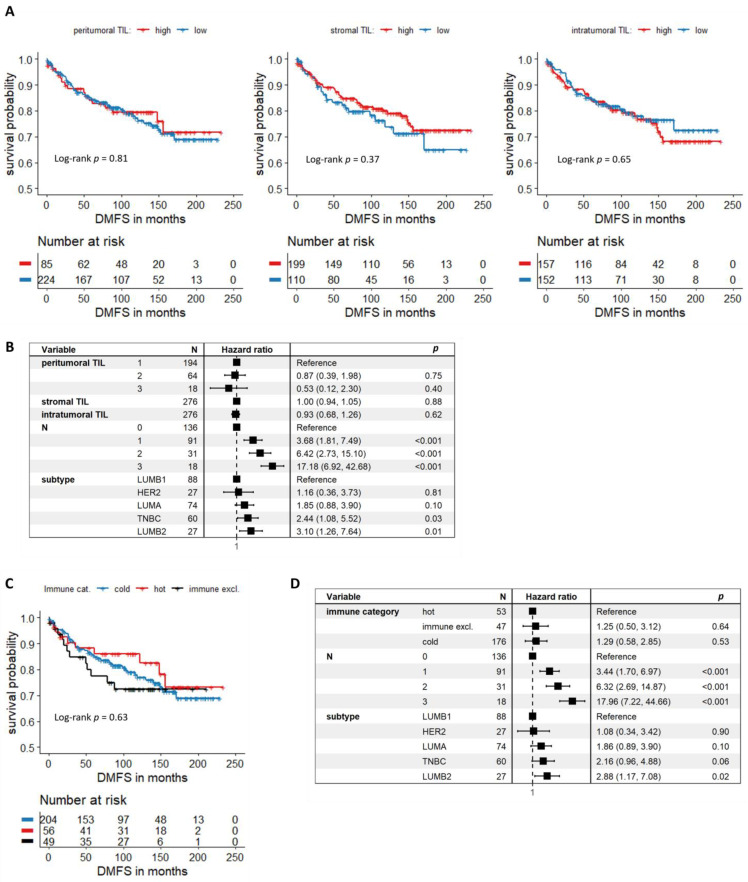
Figure 2.
Associations between DMFS and TIL levels at different localizations: (A), Kaplan–Meier curves of patients with high and low pTIL, sTIL and iTIL (n = 309). (B), Forest plot depicting multivariate Cox regression results where TILs at different localizations were treated as independent variables. Patients (n = 276) were stratified based on tumor grade. (C), Kaplan–Meier curves of patients with cold, hot and immune-excluded tumors (n = 309). (D), Forest plot depicting multivariate Cox regression results where one independent variable is the tumors’ immune category. Patients (n = 276) were stratified based on tumor grade.

