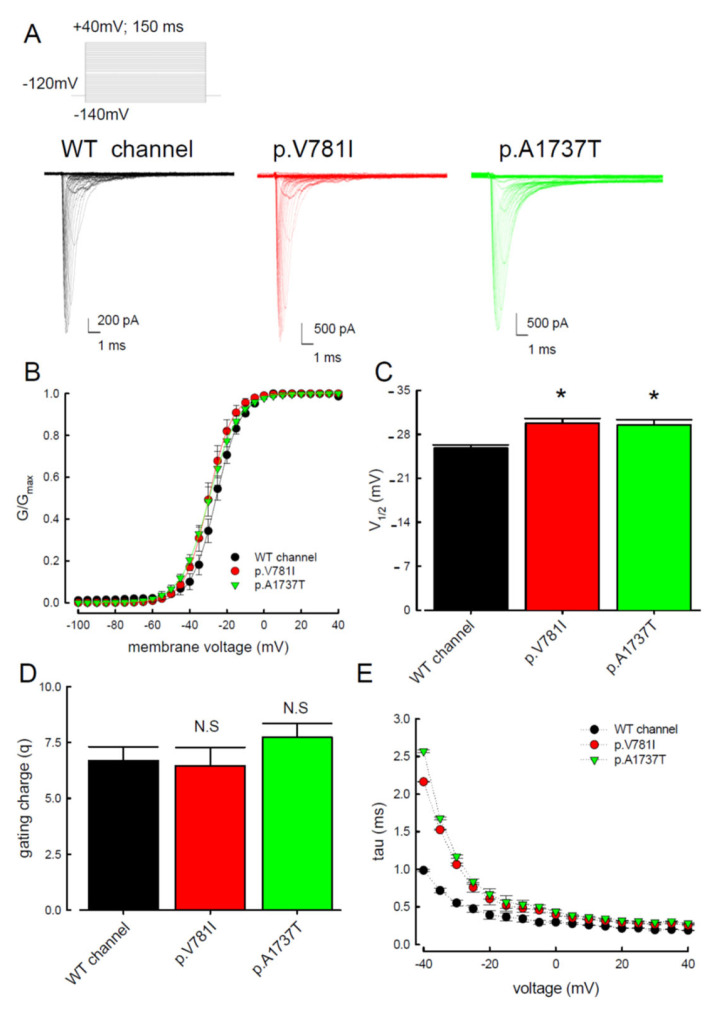
Figure 1.
Analysis of the WT and the p.V781I and p.A1737T mutant sodium current activation process. (A) Cells voltage-clamped at −120 mV were subjected to a series of 150 ms long pulses, sampled between −140 and +40 mV in 5 mV increments. Sample sweeps from WT, p.V781I, and p.A1737T mutant Nav1.4 channels were recorded. (B) Sodium current activation curves (continuous lines) fitted to the data (symbols) by the Boltzmann function. Data are expressed as means and standard deviations (n = 10). (C) The half-activation potential V1/2 of these different channels was −25.8 ± 0.2 mV, −29.8 ± 0.6 mV, and −29.5 ± 1.3 mV for the WT, p.V781I, and p.A1737T mutant channels, respectively. Data are expressed as means ± SEM (n = 10; * p < 0.05 compared to control). (D) Note that the cumulative data displayed indicate that the slope (k) for the Nav1.4 channel was associated with the WT, p.V781I, and p.A1737T mutant channels. Data are expressed as means ± SEM (n = 10, N.S. = no statistically significant difference compared to control). (E) The fast inactivation time constants (tau) were obtained by fitting the decay phase of transient Na+ currents of WT, p.V781I, and p.A1737T mutant channels shown in (A) with a mono-exponential function. Data are expressed as means ± SEM.

