Figure 3.
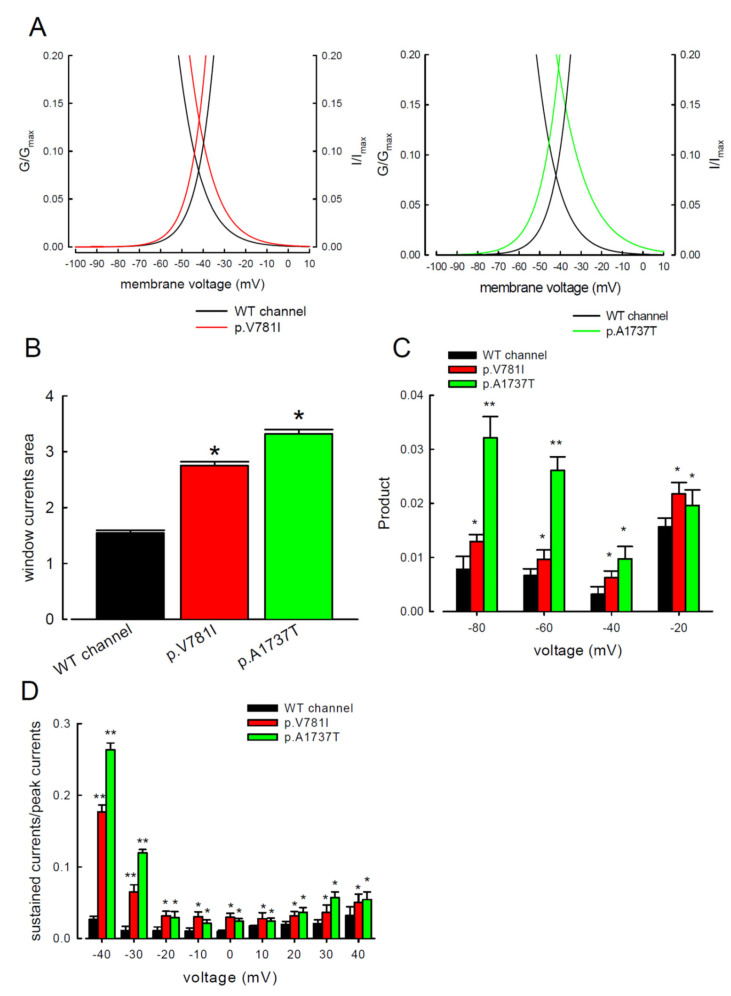
The p.V781I and p.A1737T mutant channels had extensive window currents. (A) The black (WT) and colored (p.V781I, red; p.A1737T, green) lines are the zoomed-in portions of the activation and inactivation curves in Figure 1A and Figure 2A. The window currents were calculated in the range between −100 and +10 mV. (B) The area of the window current, which was under the intersection of the activation curve (+10mV) and the inactivation curve (−100 mV), was calculated using Python 9.0 [16]. The vertical bar graph shows the integral calculation of the area under activation and inactivation curves of the three channels (* p < 0.05). (C) The values of the product of the ratios G/Gmax and I/Imax (activation from Figure 1A multiplied by inactivation from Figure 2A) are plotted against the specific voltage at −80, −60, −40, and −20 mV in the WT, p.V781I, and p.A1737T mutant channels (* p < 0.05 and ** p <0.01). (D) The ratio between the sustained (currents averaged between 90 and 100 ms of the pulse) and the peak transient Na+ currents was significantly higher in the p.V781I and p.A1737T mutant channels than in the WT channel (* p < 0.05, and ** p < 0.01).

