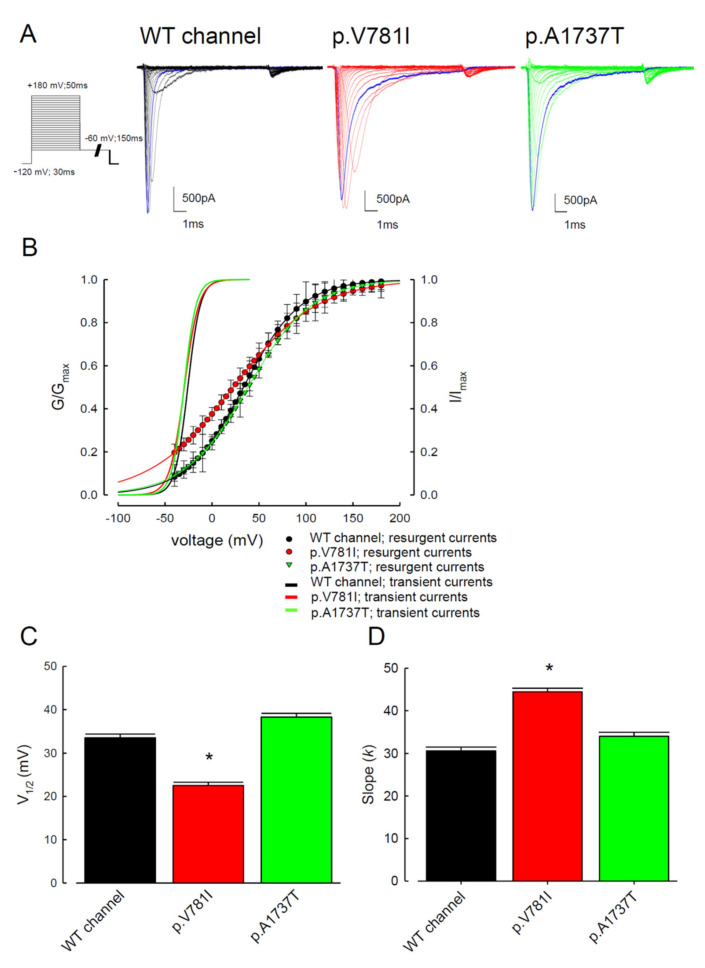
Figure 5.
The steady-state activation curve for resurgent Na+ currents in the WT and the p.V781I and p.A1737T mutant channels. (A) The cells were held at −120 mV for approximately 30 ms, and then subjected to various 10 ms depolarizing prepulse sampling between −100 and +180 mV range with stepwise 10 mV increments for about 50 ms. Repolarization pulses evoked the resurgent Na+ currents at −60 mV for approximately 150 ms. We obtained sample sweeps from the WT and the p.V781I and p.A1737T mutant Nav1.4 channels. The blue traces demonstrate that inactivated currents in the p.V781I and p.A1737T mutant channels were slower than those in the WT channels. (B) The steady-state activation curves of the transient (fitted lines in Figure 1B replotted for comparison) and resurgent Na+ currents. The resurgent Na+ activation curve for each cell was obtained by fitting the data with a Boltzmann function. (C,D) The population data (n = 8) for Vh and q. The mean values were 33.4 ± 0.8 mV and 30.6 ± 0.8 for the WT channel, respectively. Those for the p.V781I mutant channel were 22.5 ± 0.7 mV (n = 8; * p < 0.05) and 44.4 ± 0.9 (n = 8; * p < 0.05), and those for the p.A1737T mutant channel were 38.27 ± 0.8 mV (n = 8; * p < 0.05) and 33.9 ± 0.9.

