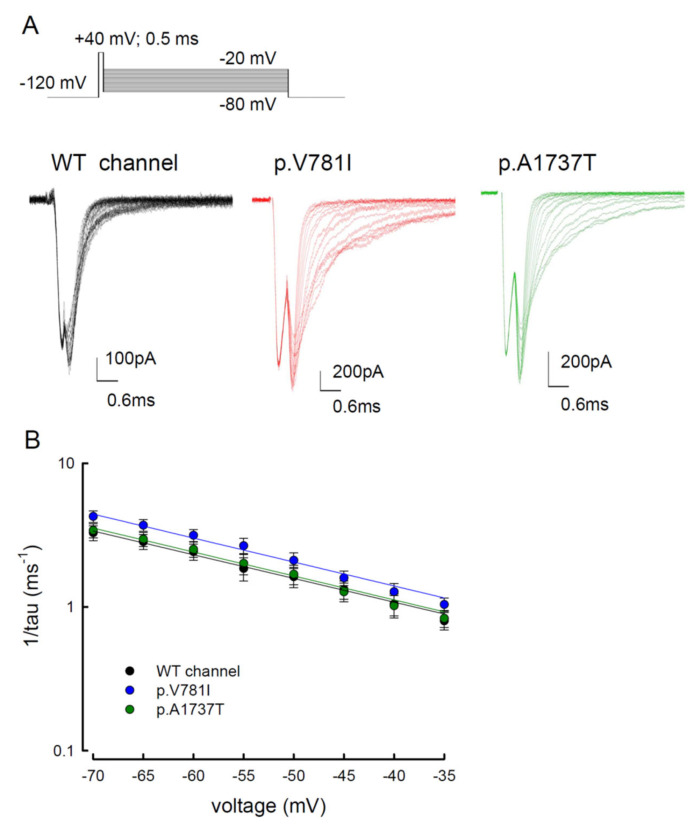
Figure 8.
The tail current protocol was used to estimate the steady-state activation curve for the WT, p.V781I, and p.A1737T mutant channels. (A) The cells were held at −120 mV and depolarized with a voltage of +40 mV for approximately 0.5 ms of the activation pulse, followed by repolarization from −80 mV to −20 mV for approximately 20 ms in the WT, p.V781I, and p.A1737T channels. The tail currents showed faster decay kinetics as the deactivating pulse became more negative. (B) The decay phase of tail currents in (A) was fitted using a mono-exponential function for different deactivating potentials in the WT, p.V781I, and p.A1737T channels. The reciprocal of time constants of the decaying phase in tail currents was plotted against voltages in a semi-logarithmic scale for the WT, p.V781I, and p.A1737T channels. The lines were linear regression fitted using the formulas 1/tau(V) = 0.2 × exp(−0.9 V/25) ms−1, 0.2 × exp(−0.9 V/25) ms−1, and 0.2 × exp(−0.9 V/25) ms−1 for the WT, p.V781I, and p.A1737T channels, respectively.

