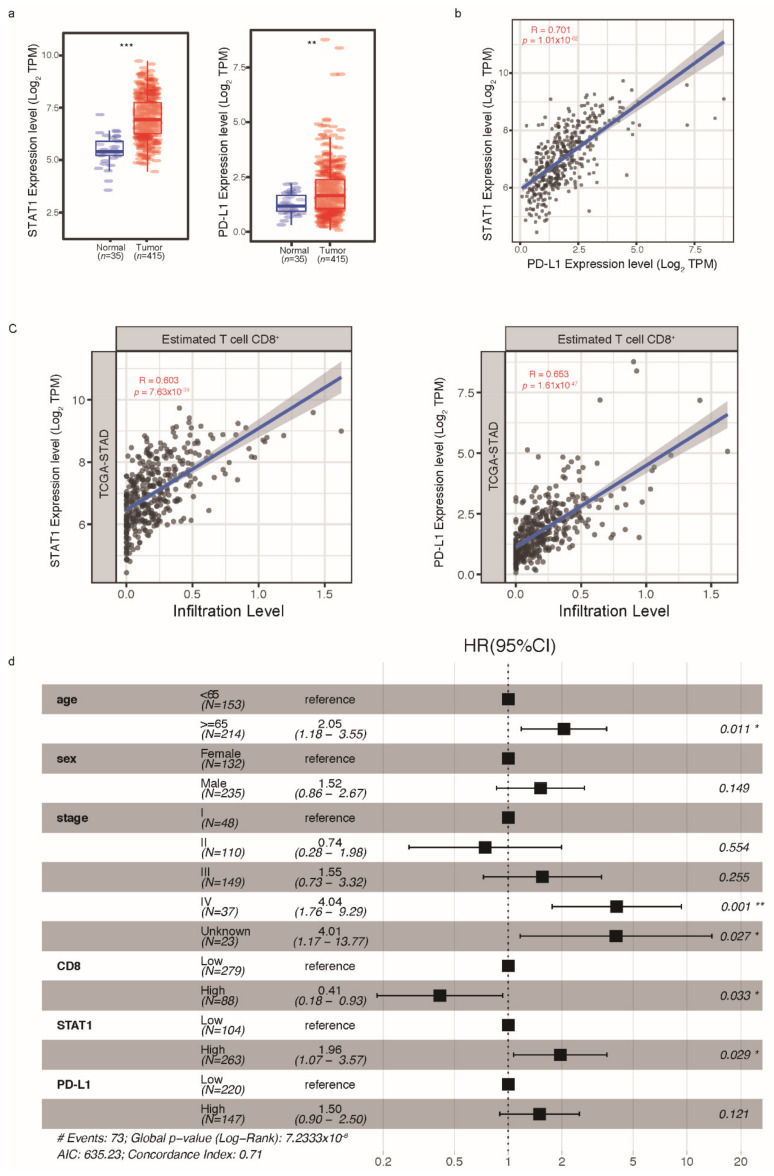
Figure 3.
Transcriptome analysis of STAT1 and PD-L1 based on the TCGA-STAD database. (a) Expression of STAT1 and PD-L1 in tumor tissues (n = 415) and normal tissues (n = 35). (b) Correlation of STAT1 and PD-L1 expression in tumor tissues. (c) Correlations of STAT1 and PD-L1 with immune infiltration levels. (d) Multivariable Cox regression analysis of GC. Wilcoxon rank-sum test, * p < 0.05, ** p < 0.01, *** p < 0.001. CI, confidence interval; GC, gastric cancer; HR, hazard ratio; TCGA-STAD, The Cancer Genome Atlas-Stomach Adenocarcinoma.

