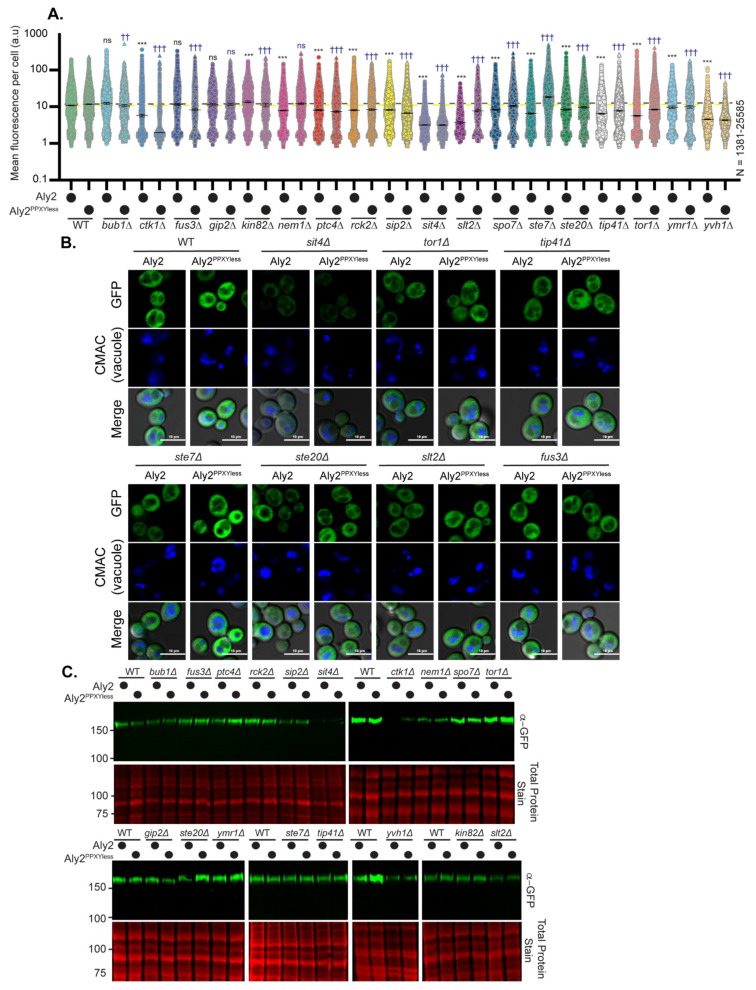
Figure 4.
Kinases and phosphatases from the KinDel screen alter the abundance and electrophoretic mobility of Aly2: (A) Cells expressing the indicated Aly2 protein fused to GFP (pRS415-TEF1pr plasmids) in either WT or the noted gene deletion backgrounds were imaged by high-content confocal microscopy, and whole-cell fluorescence of the cells was quantified using NIS.ai and Nikon GA3 software. The mean fluorescence intensity from whole-cell measurements (in arbitrary units, au) is plotted for each cell as a circle. The median fluorescence intensity is shown as a black line for each group and the error bars represent the 95% confidence interval. A yellow or black dashed line represents the median fluorescence intensity for Aly2 or Aly2PPXYless expressed in WT cells, respectively. Kruskal–Wallis statistical analysis with Dunn’s post hoc test was performed to compare the fluorescence distributions to the cognate WT. In black asterisks (*) or blue daggers (†), comparisons are made to Aly2 or Aly2PPXYless in WT cells, respectively (ns = not significant; three symbols have a p-value < 0.0005). (B) A subset of the fluorescent microscopy images acquired for the data presented in (A) are shown. CMAC is used to stain the vacuoles (shown in blue). Merge is overlaid with the transmitted light cell image as well as the fluorescence images. (C) Whole-cell extracts from the cells described in (A) were made, analyzed by SDS-PAGE and immunoblotting, and detected using an anti-GFP antibody. The REVERT total protein stain of the membrane is shown as a loading control. Molecular weights are shown on the left side in kDa.

